Published 11 April 2023
As the world struggles toward lofty decarbonization goals and multilateral negotiations bog down over who should pay for climate change, finding a way to price carbon has become central to the future of global trade. We asked the data artists at Visual Capitalist to illustrate the evolution of a vital market.
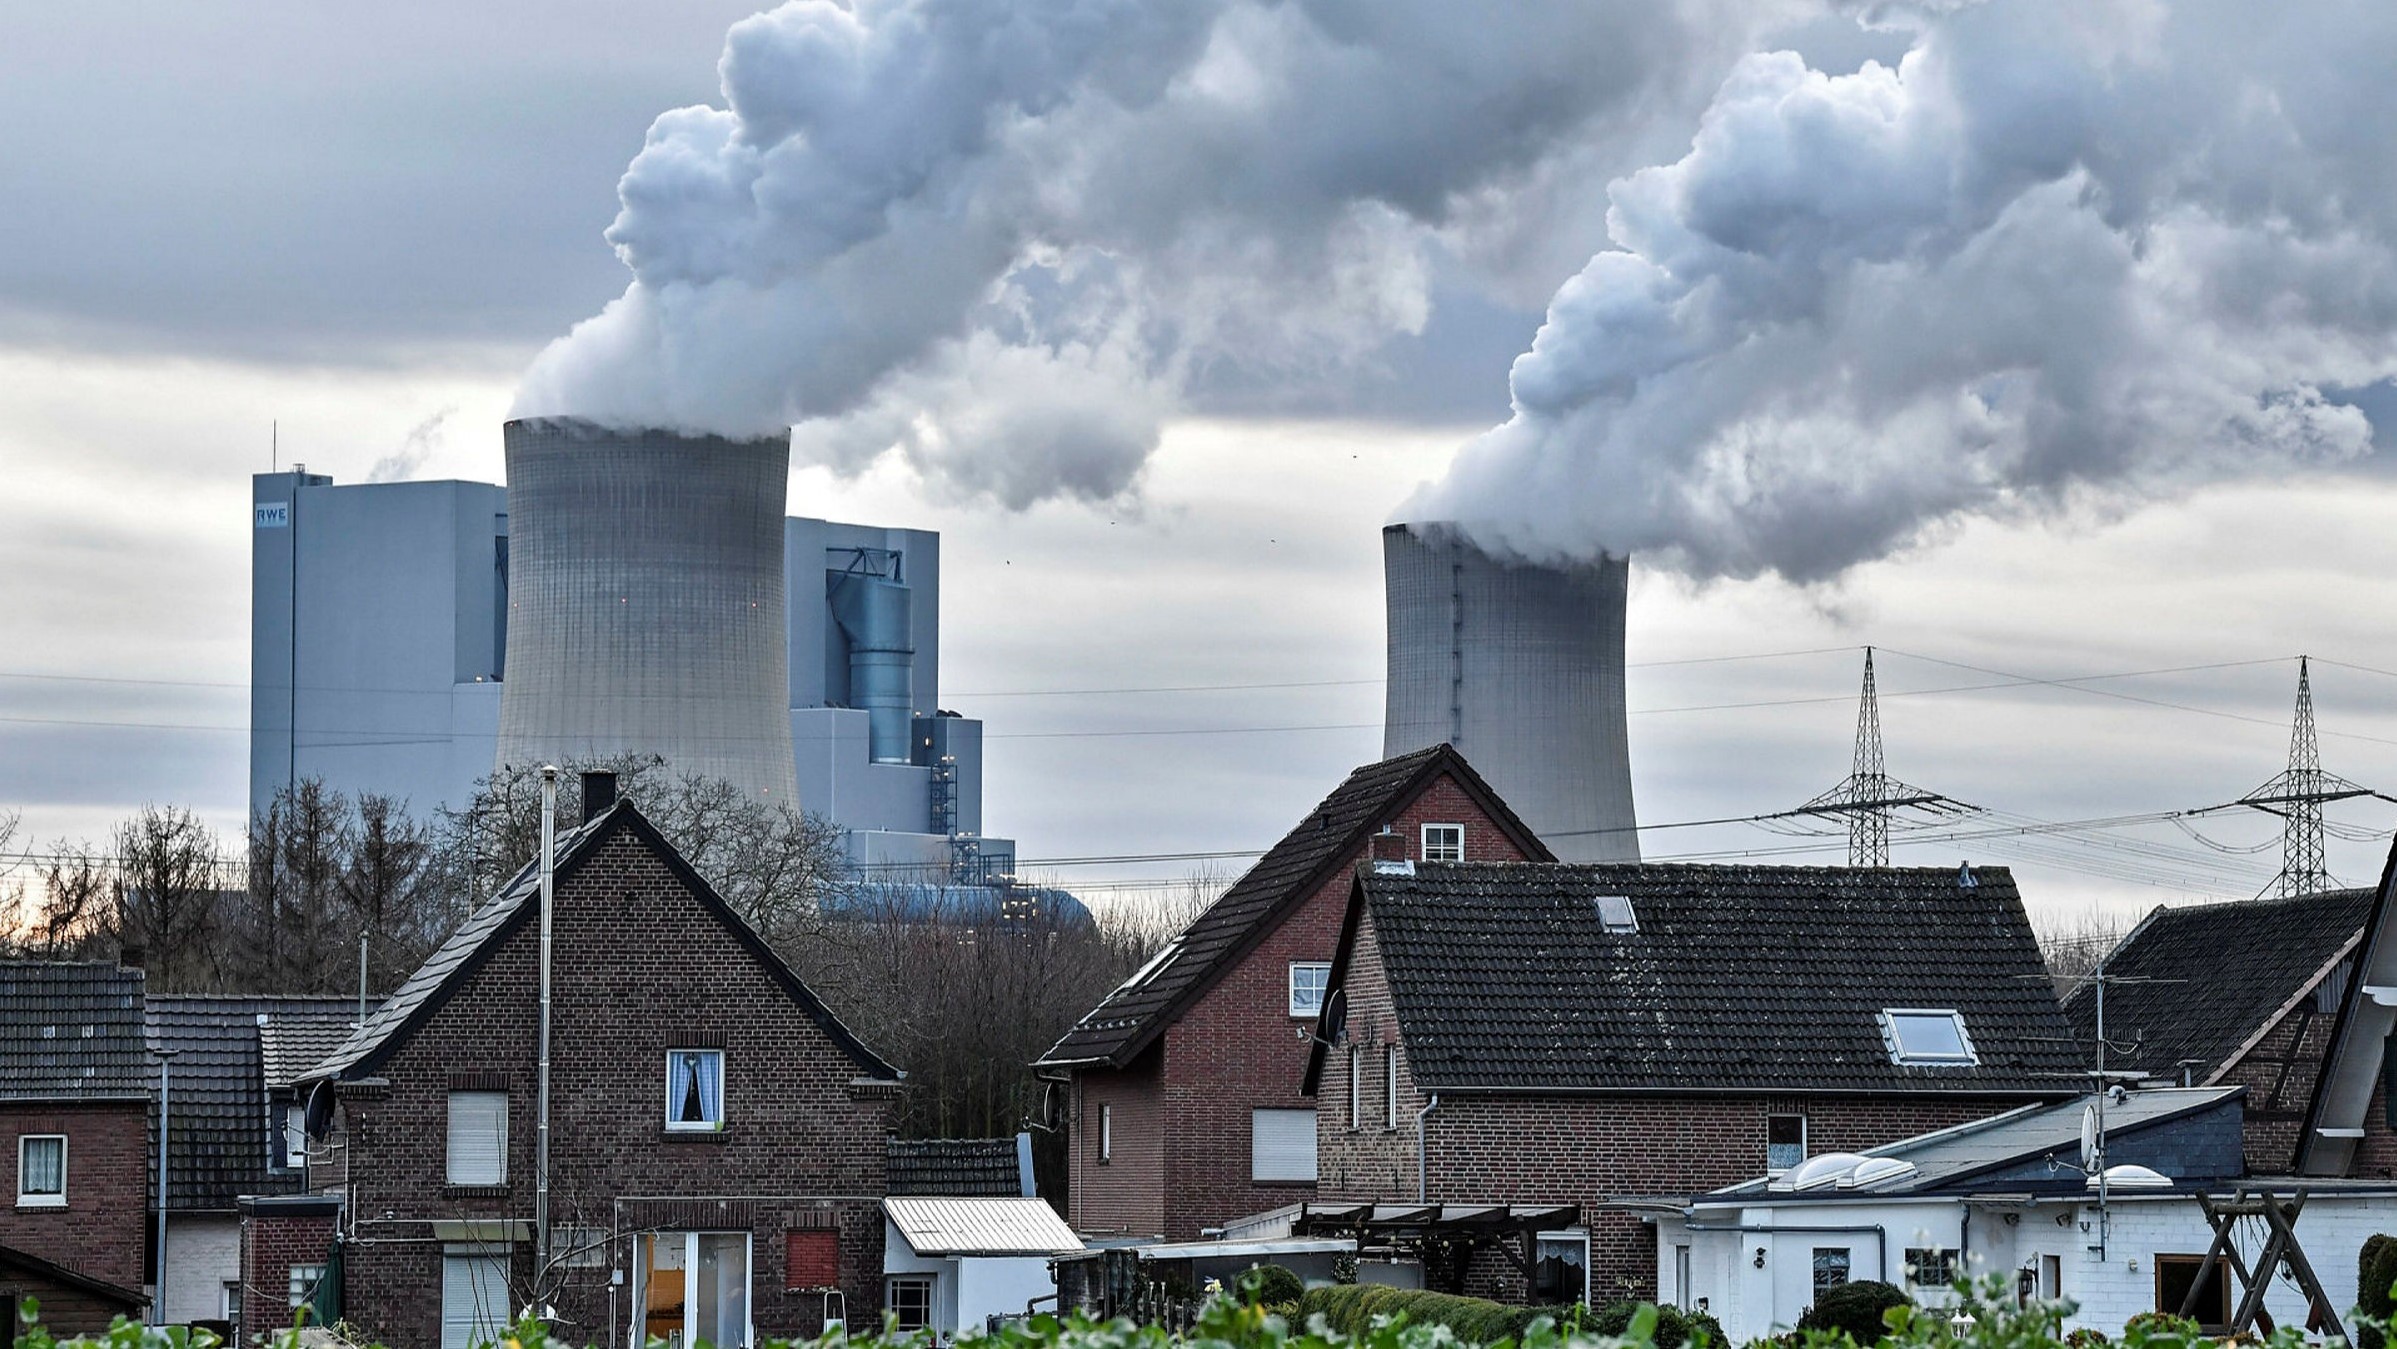
Over two centuries of industrialization, economic growth has mostly relied on the burning of fossil fuels. The emissions, much of it driven by trade, are no longer sustainable. While governments coalesce around targets to achieve zero net carbon emissions by 2050, they are far from agreement on how to devise markets that can effectively price carbon.
Carbon markets around the world remain in varying stages of development. Most, including in some of the biggest emitting economies, are fledgling and fragmented in their approach. Some are voluntary. Others demand compliance. The different systems mean a sprawling range of carbon prices that continue to bedevil climate goals. Take China and Europe, for example. Greenhouse gas emissions in China cost around $8 per metric ton of carbon dioxide equivalent. In Europe, they cost nearly $100/tCO2e.
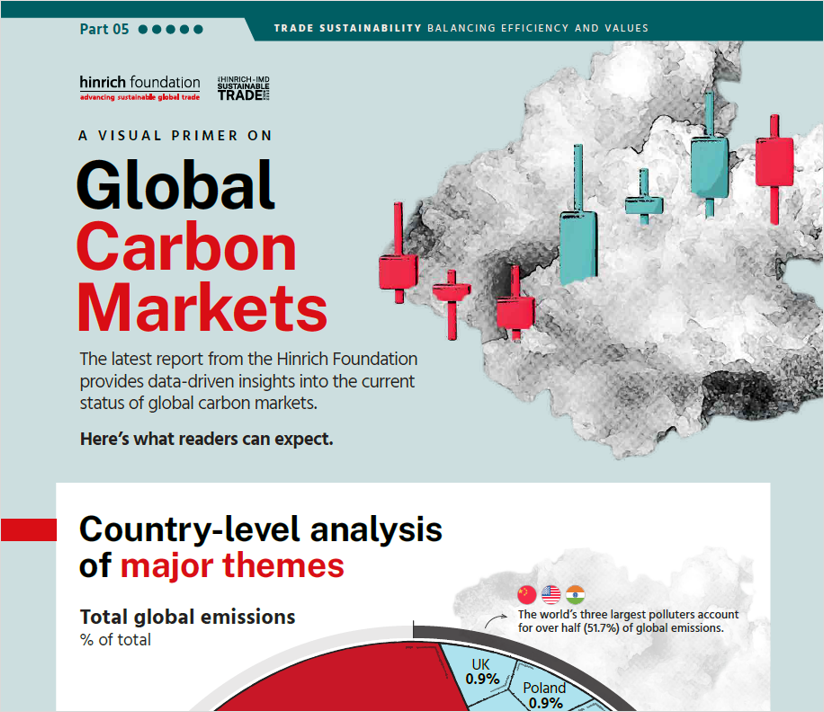
Download A Visual Primer on Global Carbon Markets by Visual Capitalist:
The spread is an indication of the distance the world has to cover to converge on a unified approach toward net zero. And a key problem underlying this distance is an age-old dispute: who should pay for climate change, and what’s the fair share?
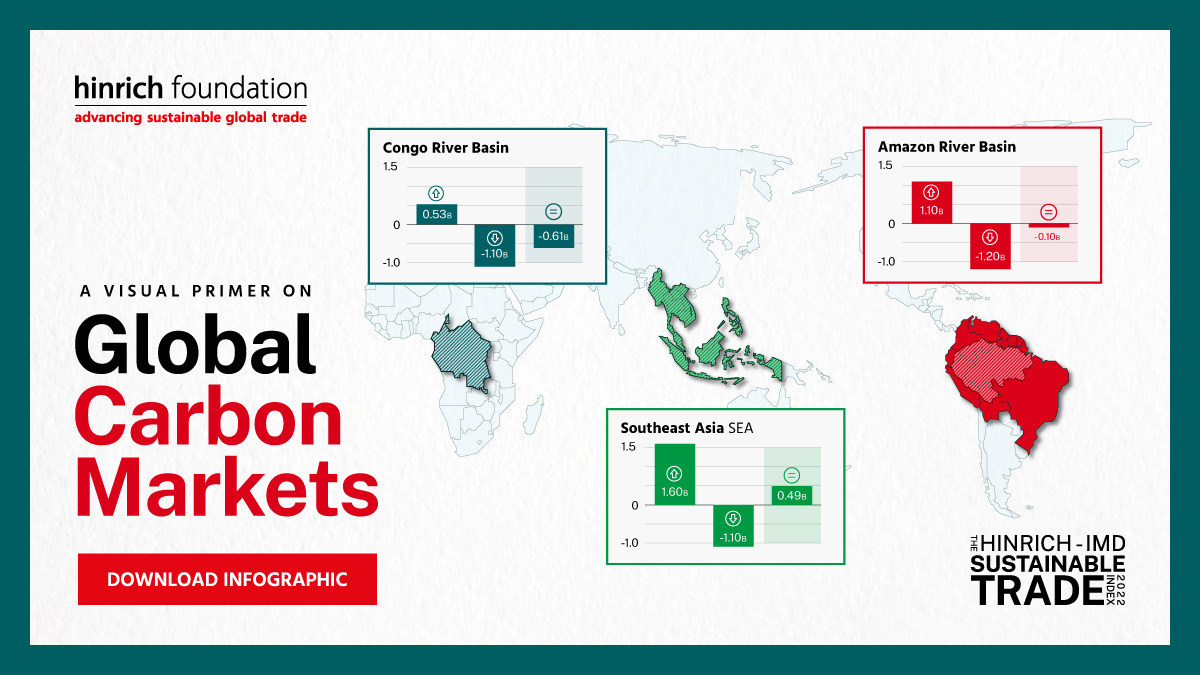
The Hinrich-IMD Sustainable Trade Index 2022 measures the capacity of 30 economies to trade in a sustainable manner. Among its measures is carbon emissions per capita, and it shows that developed economies including the US, Canada, and Australia are among the world’s biggest polluters. Less developed economies have long argued that wealthier countries should bear the greater financing burden and respect the Global South’s sovereign right over its own development.
In this infographic, Visual Capitalist illustrates the world’s biggest emitters, the coverage of current jurisdictions, and carbon’s relationship with global growth. For more in-depth Global Carbon Markets insights covering the world of CO2, development of carbon markets, the carbon market landscape, major carbon markets, challenges and outlook, explore their visual deep dive report.
![]()
This infographic is part of the Hinrich-IMD Sustainable Trade Index 2022. The Sustainable Trade Index is currently in its fourth edition.
© The Hinrich Foundation. See our website Terms and conditions for our copyright and reprint policy. All statements of fact and the views, conclusions and recommendations expressed in this publication are the sole responsibility of the author(s).
Author