Published 18 April 2023
Finding a way to price carbon has become central to the future of global trade. We asked the data artists at Visual Capitalist to illustrate a primer on the evolution of a vital market.
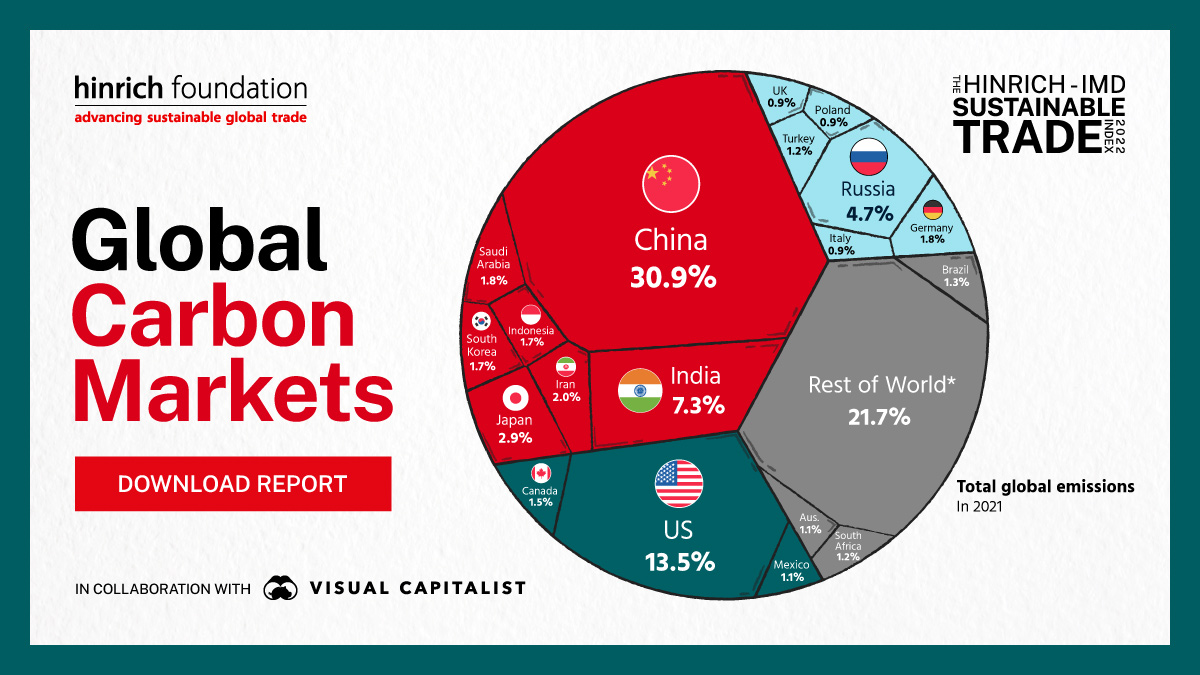
The global carbon market is worth nearly US$1 trillion, triple its volume in 2020. The huge surge is a response to a belated realization. Over two centuries of industrialization, economic growth has mostly relied on the burning of fossil fuels. The emissions from such activities, much of it driven by trade, are no longer sustainable. Yet, even as governments around the world coalesce around targets to achieve zero net carbon emissions by 2050, they are far from agreement on how to devise markets that can effectively price carbon.
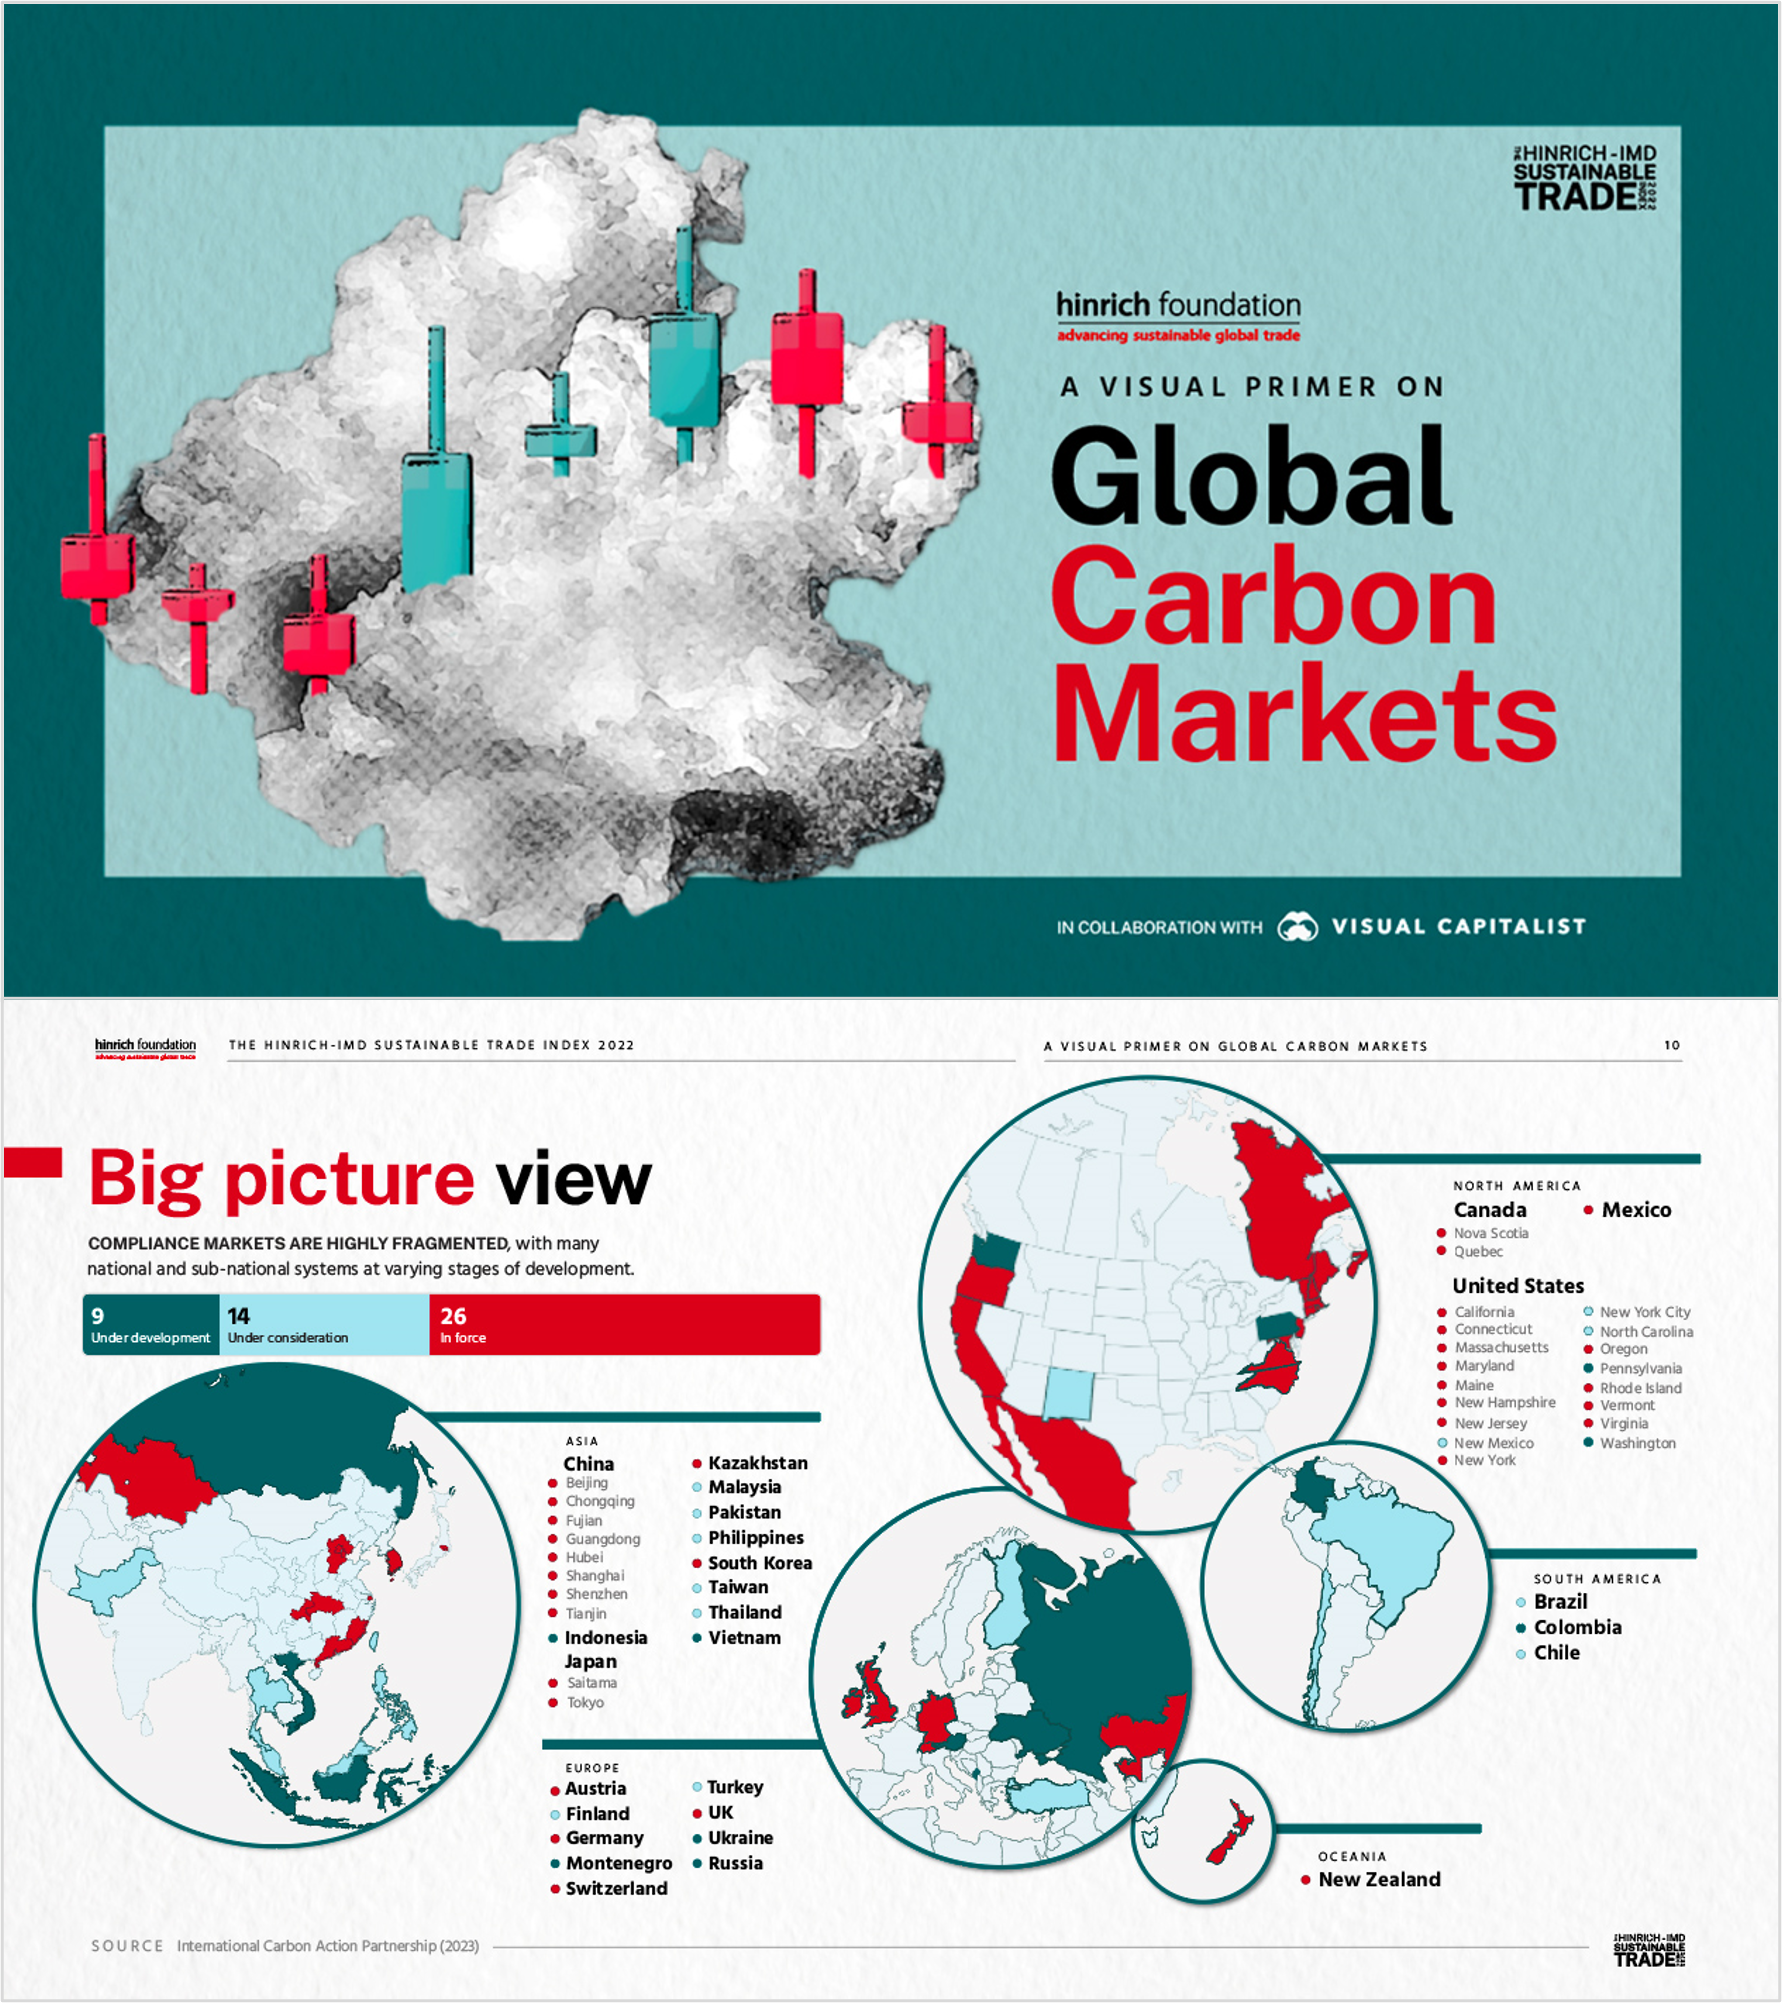
Carbon markets around the world remain in varying stages of development. Most, including some of the biggest emitting economies, are fledgling and fragmented in their approach. Some are voluntary. Others demand compliance. Some jurisdictions set ceilings on industry emissions and allow companies to swap carbon credits to meet the ceiling. Others let companies generate credits based on the magnitude of their emissions reductions then sell these credits to other emission producers that can’t clean up as quickly.
Download A Visual Primer on Global Carbon Markets by Visual Capitalist:
These systems each have their advantages depending on the development context of their economies. But it means a sprawling range of carbon prices that continue to bedevil convergence on climate goals. In China, the world’s largest emitter by volume but also the largest jurisdiction that mandates net zero compliance, greenhouse gas emissions currently cost around $8 a metric ton of carbon dioxide equivalent – a level that analysts say isn’t anywhere close to being high enough to drive real behavioral changes among corporates. Its price is a world apart from the nearly $100/tCO2e charged for European emissions.
There’s another problem. Richer countries are by far the largest emitters, and poorer countries say wealthier polluters should pay more for climate change. But at what price?
The Hinrich-IMD Sustainable Trade Index 2022 measures the capacity of 30 major global economies to trade in a sustainable manner. Among its measures is carbon emissions per capita. The ranking, which Visual Capitalist includes in its Deep Dive, shows developed economies such as the US, Canada, and Australia among the biggest emitters per capita in the world.
Less developed economies have long argued that wealthier countries should also respect the Global South’s sovereign right over its own development. Some less developed economies are taking steps to form a cartel to control carbon credit prices, recognizing that they sit atop an equatorial belt of “mega-diverse” ecosystems home to more than half the world's tropical rainforests, which are vital to trapping carbon dioxide emissions.
In its Deep Dive, which takes its cue from our Sustainable Trade Index, Visual Capitalist explores these new and tumultuous carbon markets. In it, you’ll find the world’s biggest emitters, the coverage of current jurisdictions, and carbon’s relationship with global growth.
And it is a reminder that trade in carbon credits can help companies and the world meet ambitious climate goals. Carbon markets are a vital mechanism for the planet’s future growth – and to the future of global trade itself. For a snapshot on Global Carbon Markets, view the infographic here.
This visual report is part of the Hinrich-IMD Sustainable Trade Index 2022. The Sustainable Trade Index is currently in its fourth edition.
© The Hinrich Foundation. See our website Terms and conditions for our copyright and reprint policy. All statements of fact and the views, conclusions and recommendations expressed in this publication are the sole responsibility of the author(s).
Author
Visual Capitalist
Related Articles