Sustainable trade
Sustainable Trade Index 2023
Published 24 October 2023
The Hinrich-IMD Sustainable Trade Index (STI) measures the capacity of 30 major global economies to participate effectively and sustainably in trade, on the basis of 71 economic, societal, and environmental indicators. The 2023 Index points to the rising fragmentation of the global trade landscape, and sets a backdrop for how we must enable trade to achieve optimal outcomes for our human and natural capital.
About the STI 2023
In today's dynamic economic and geopolitical landscape, we're witnessing a shift from an era of rapid globalization to one of trade fragmentation and rising protectionism. How will this age of fragmentation transform global trade and economic policy as well as sustainability practices? The Hinrich-IMD STI 2023 assesses these factors.
The STI measures the capacity of 30 diverse economies to align global trade policies with long-term objectives for economic growth, societal development, and environmental protection. This fifth iteration of the Index uses 71 indicators grouped into three core pillars.
Overview of the STI 2023 findings
We summarize the key insights of the Sustainable Trade Index 2023 in this video. Find out who the top performers are and what drives their success.
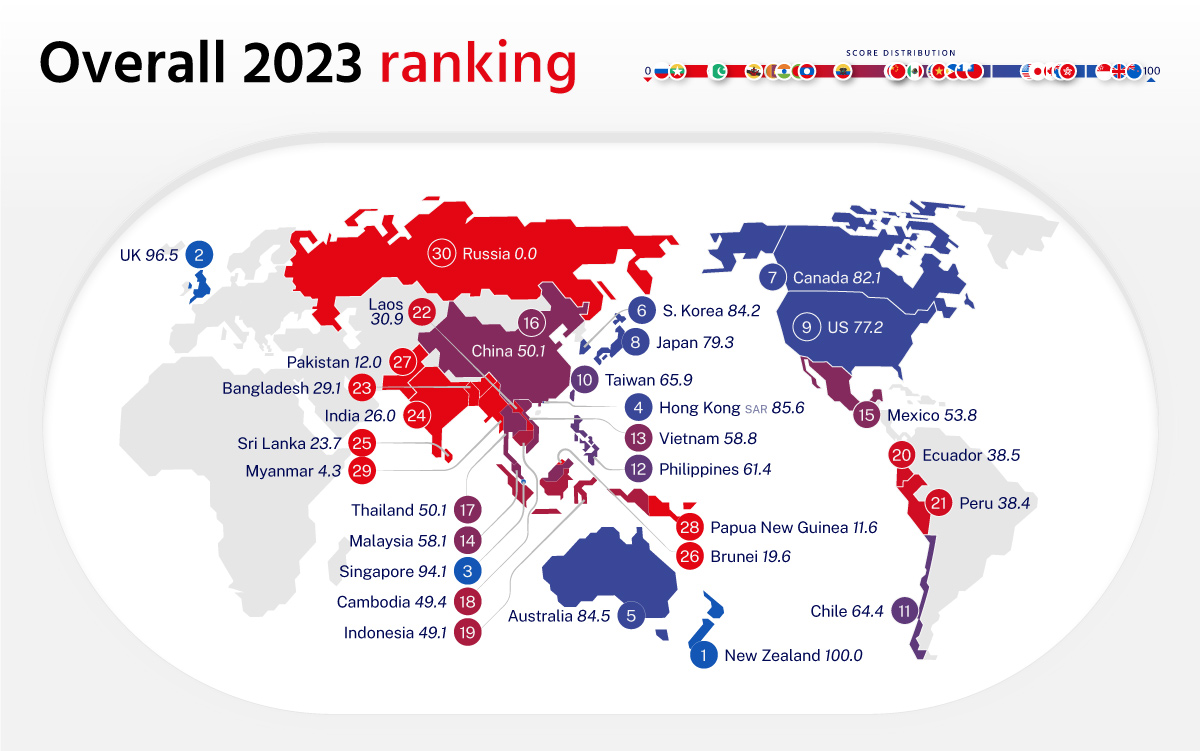
- New Zealand and the United Kingdom maintain their top two positions in the overall ranking, as with the 2022 results. Singapore advanced two positions from last year into third place.
- New Zealand’s achievement is the result of its robust performance in all pillars, ranking first in the environmental pillar, second in the societal pillar, and eighth in the economic pillar.
- Top-ranking economies in the economic pillar exhibit robust infrastructure and a strong commitment to technological innovation, facilitated and supported by access to adequate financing. Economies where the private sector enjoys ample funding opportunities thrive. Leading the rankings in this pillar are Singapore, South Korea, Hong Kong, the United States, and the United Kingdom.
- In the societal pillar, the STI emphasizes that political stability, higher economic equity, high educational attainment, and social mobility are key to top performance. Notable top performers in this category include Canada, New Zealand, Australia, the United Kingdom, and Japan.
- In the environmental pillar, economies that uphold stringent environmental standards and effectively address critical issues like wastewater management, air pollution control, carbon emissions reduction, and energy efficiency are ranked at the top. Exemplary in this domain are New Zealand, the United Kingdom, Mexico, the Philippines, and Singapore.
The Interactive Index and economy-specific reports
The detailed results for the 30 economies reviewed in the STI are presented in the main report. An interactive Excel workbook with the overall rankings and indicator rankings, and economy profiles are also available for download.
| 1st | New Zealand | 16th | China | |||
| 2nd | United Kingdom | 17th | Thailand | |||
| 3rd | Singapore | 18th | Cambodia | |||
| 4th | Hong Kong, SAR | 19th | Indonesia | |||
| 5th | Australia | 20th | Ecuador | |||
| 6th | South Korea | 21st | Peru | |||
| 7th | Canada | 22nd | Laos | |||
| 8th | Japan | 23rd | Bangladesh | |||
| 9th | United States | 24th | India | |||
| 10th | Taiwan | 25th | Sri Lanka | |||
| 11th | Chile | 26th | Brunei | |||
| 12th | Philippines | 27th | Pakistan | |||
| 13th | Vietnam | 28th | Papua New Guinea | |||
| 14th | Malaysia | 29th | Myanmar | |||
| 15th | Mexico | 30th | Russia |
Deep dives and visual graphics
Deep dives are standalone reports developed in partnership with leading global economic policy analysts and graphics specialists, that each focus on a specific theme impacting sustainable trade identified in the STI.
The infographics by Visual Capitalist will use data-driven visuals to provide an overview of some of the key themes and findings of STI 2023.
***
The Sustainable Trade Index is currently in its fifth edition. Download the earlier editions below:
© The Hinrich Foundation. See our website Terms and conditions for our copyright and reprint policy. All statements of fact and the views, conclusions and recommendations expressed in this publication are the sole responsibility of the author(s).


