Published 07 March 2023
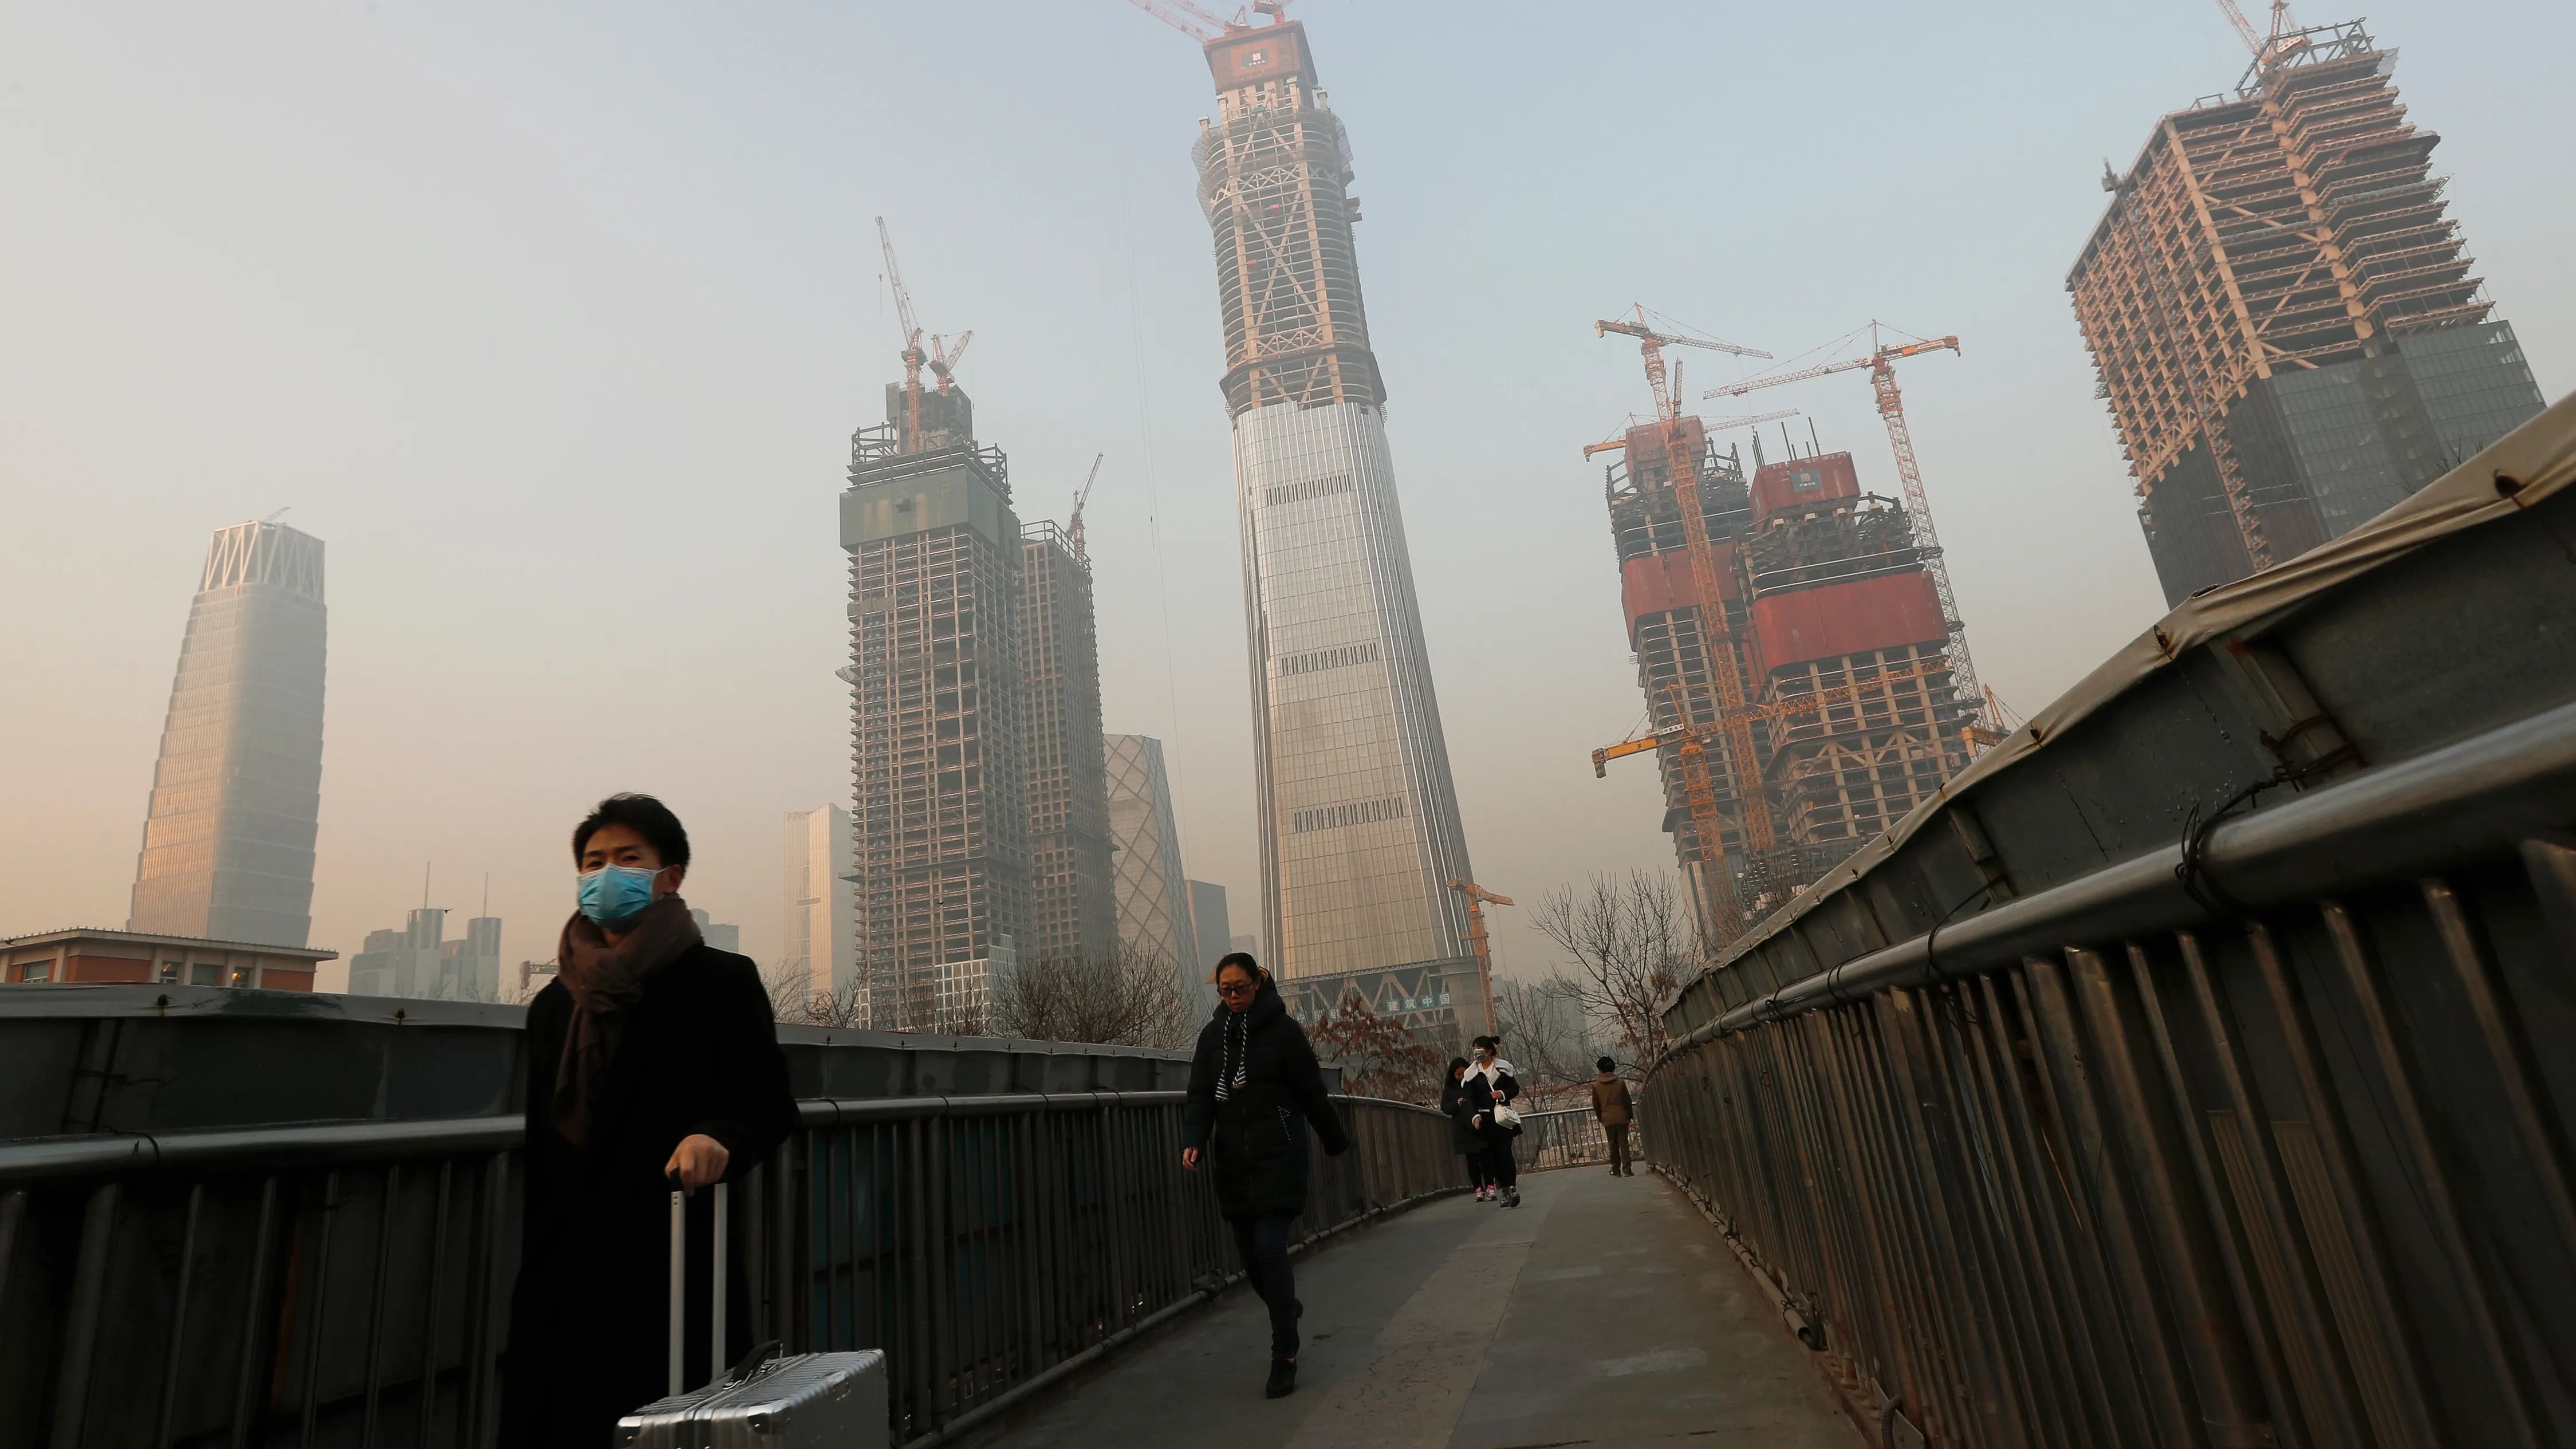
It’s not a big mystery that trade and environmental pollution are linked. Global trade fuels a lot of the world’s economic activity, which generates ecological degradation including air pollution. The data artists at Visual Capitalist lay out the findings on this factor from the Hinrich-IMD Sustainable Trade Index 2022.
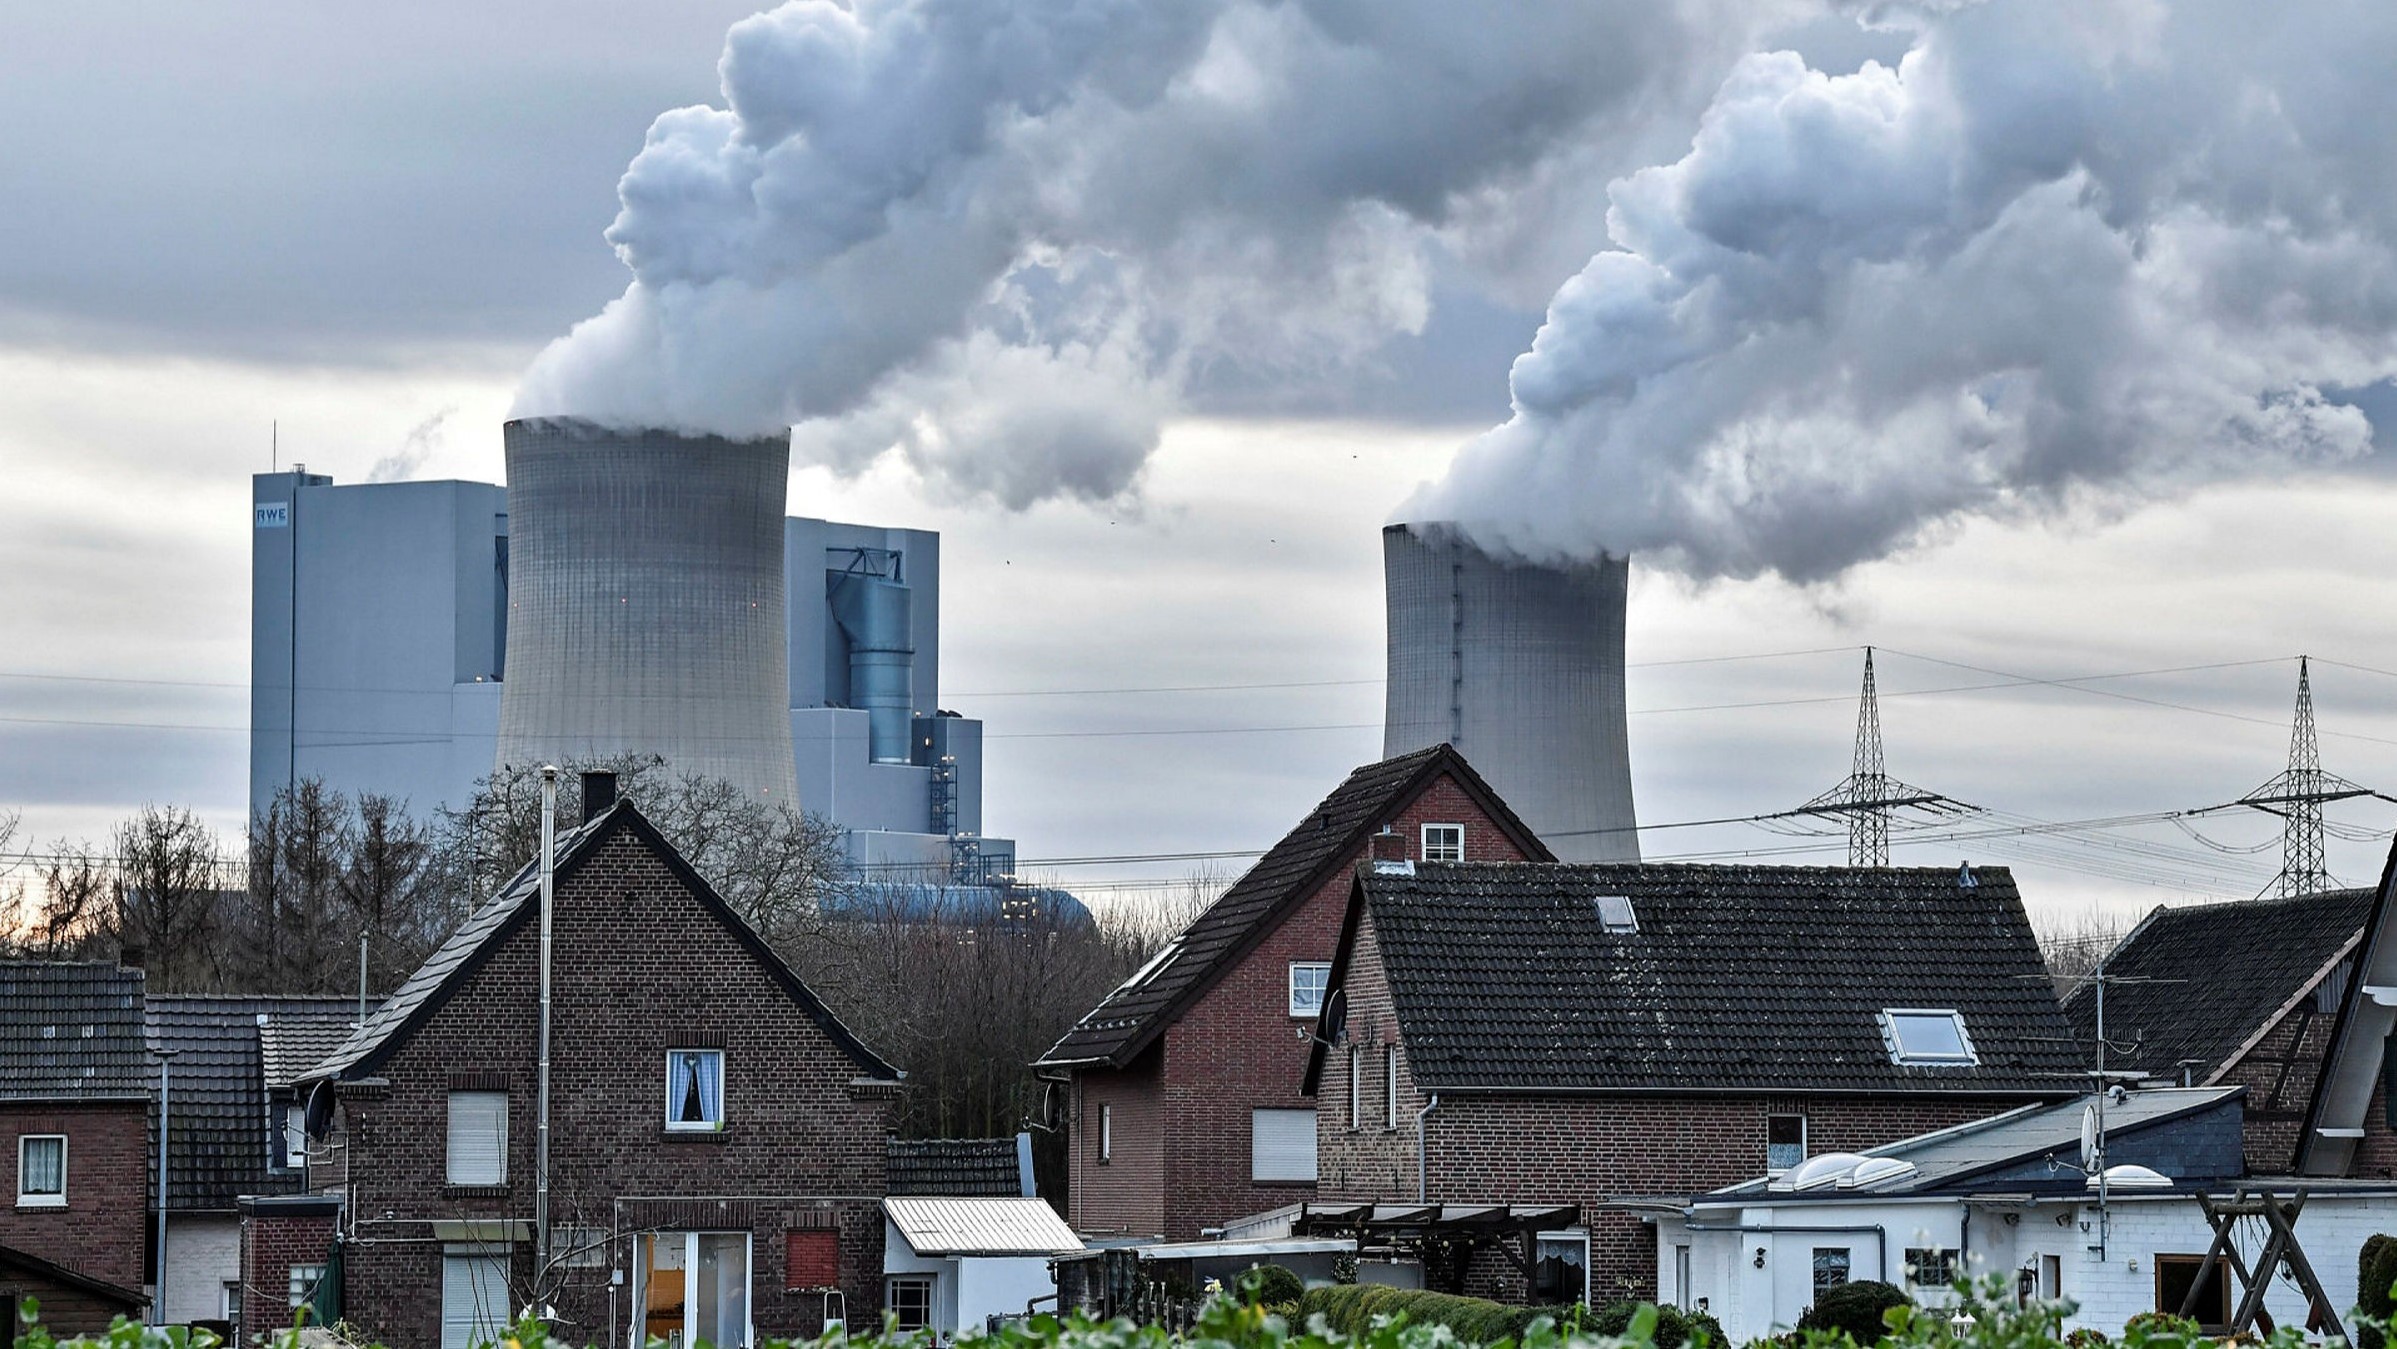
The relationship between economic growth and environmental pollution has been a longstanding global concern. Nowhere did the link become clearer than during the early stages of the Covid pandemic, when global air pollution declined by 31% year-on-year due to the worldwide lockdowns, according to mid-2020 findings by the US scientific journal Proceedings of the National Academy of Sciences.
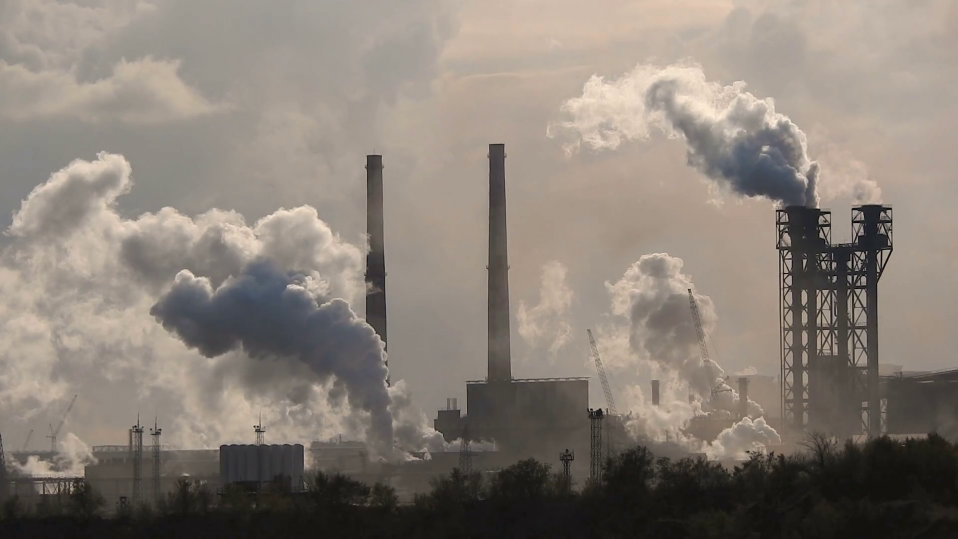
The reduction in everything from energy output to air travel sent the volume of airborne particulates tumbling. Traffic and industry slowed. Skies became clearer. Pandemic aside, we breathed easier.
But, as the world shrugs off the pandemic and continues to reopen apace, global trade is rebounding, even if geopolitics forces its restructuring. The resumption of trade and the increasing integration of global value chains raise questions about how governments, businesses, and communities must respond as they pursue economic gain. Which economic activities generate the greatest trade-related impact on the environment? Is there a correlation between national income and air pollution levels? Can an optimum blend of trade and environment policies be found?
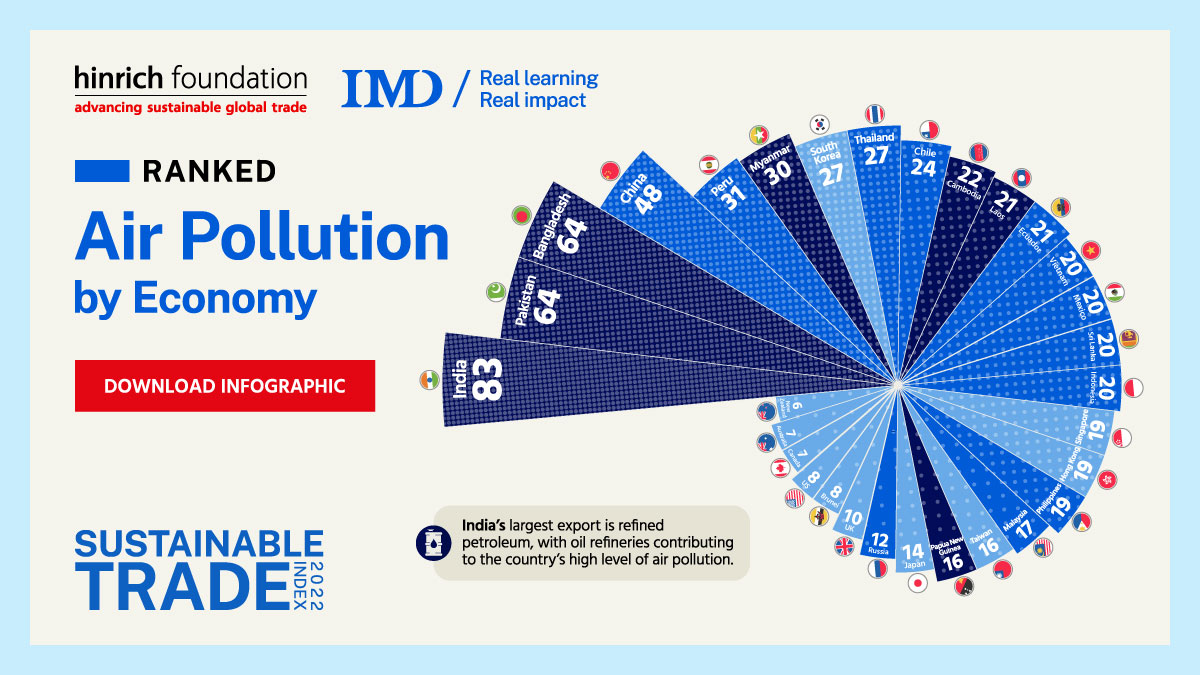
Download Air pollution by economy by Visual Capitalist:
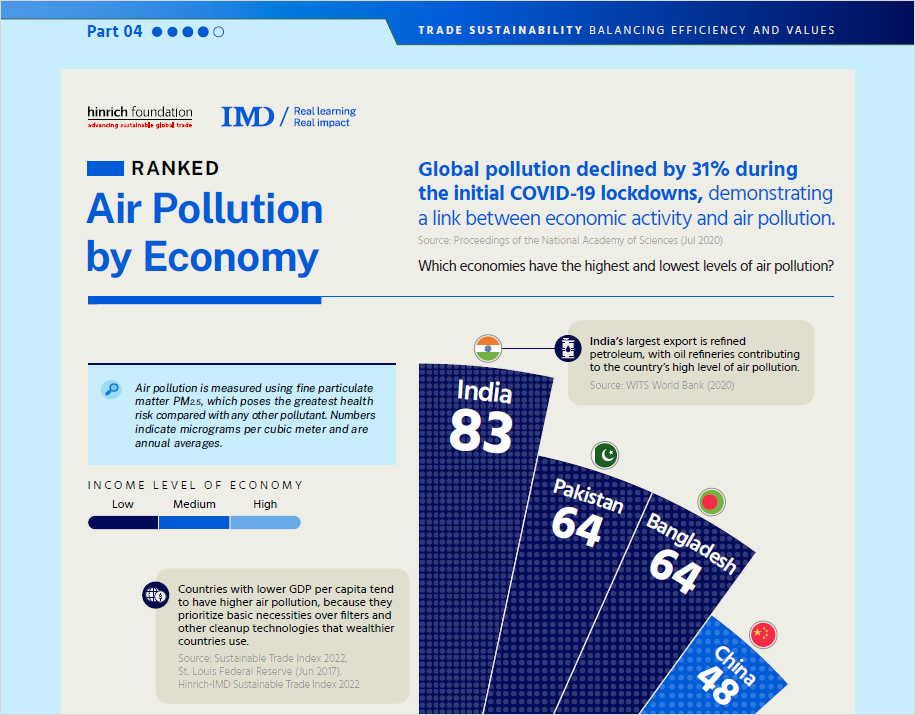
The Sustainable Trade Index 2022 ranks 30 global economies on a range of trade-related indicators, including air pollution. India topped the ranking, most likely due to its massive oil refinery complex, the nation’s largest export. India was trailed by neighbors Pakistan and Bangladesh.
The top ten polluters also included nations such as Myanmar and Peru. The data, as Visual Capitalist points out, suggests a potential link between air pollution and economic output per capita, as lower-income economies would tend to lack clean-up technologies and environmental hardware such as air filters.
China, the world’s largest trading economy, came fourth. Beijing has made some strides in forcing more stringent environmental standards on its industry, though much remains to be done. Economies that have taken pains to build renewable energy resources, such as the Philippines and Singapore, scored on the lower end of the air pollution scale. Developed economies such as the US, Canada, Australia, and New Zealand have the least polluted atmospheres, according to our ranking.
Visual Capitalist designed a depiction of the STI’s ranking of this indicator in the form of spiral. The shape occurs everywhere in nature, from conch shells to pine cones, and in this case resembles a nautilus constructed by the mathematical sequence known as the Fibonacci numbers. It’s fitting that we settled on this visualization: just as mathematics comports with nature, so too must human industry – and global trade – recognize its ineluctable impact on sustainability.
Growth and trade deplete natural resources. But trade and investment liberalization also can incentivize more rigorous environmental standards and the use of cleaner production processes and technologies. Air pollution and economic output don’t always have to move in step. Sustainable trade is key.
This infographic is part of the Hinrich-IMD Sustainable Trade Index 2022. The Sustainable Trade Index is currently in its fourth edition.
© The Hinrich Foundation. See our website Terms and conditions for our copyright and reprint policy. All statements of fact and the views, conclusions and recommendations expressed in this publication are the sole responsibility of the author(s).
Author
Visual Capitalist
Related Articles