Sustainable trade
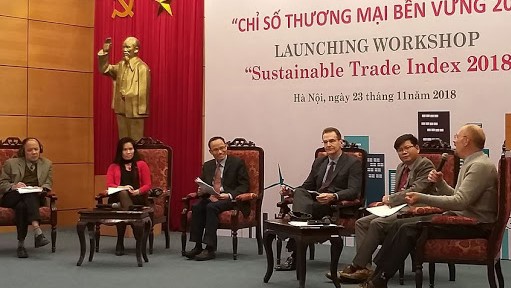
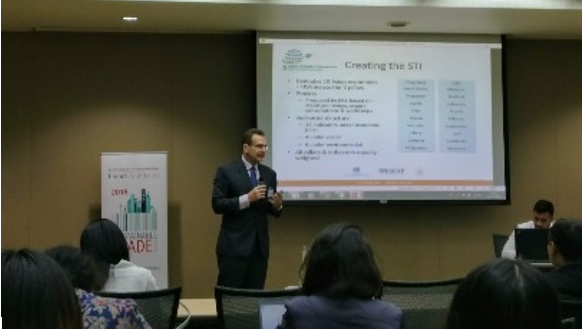
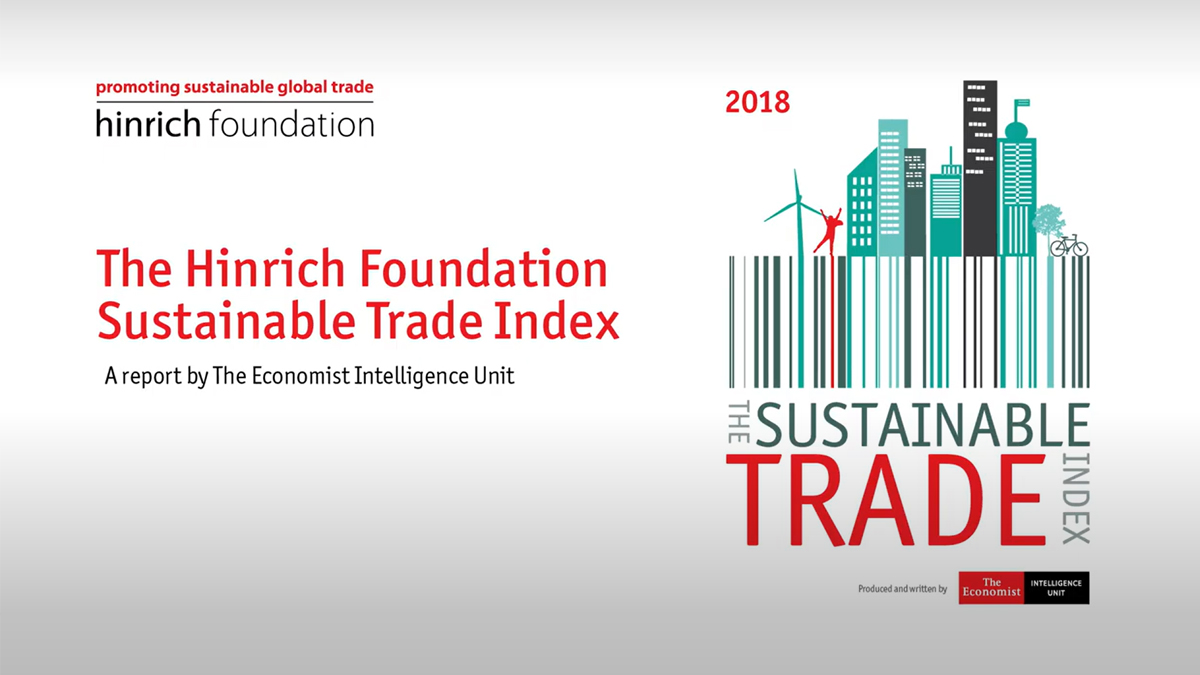
Sustainable Trade Index 2018
Published 26 June 2018
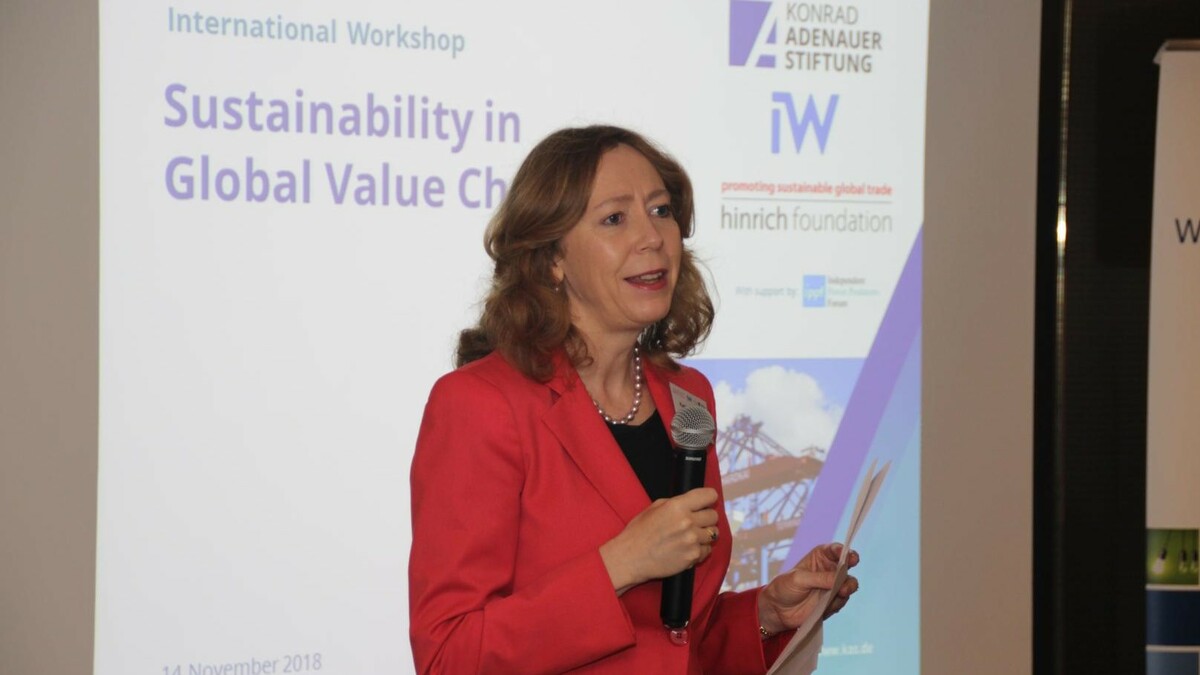
The Sustainable Trade Index 2018 evaluates the readiness of 20 Indo-Pacific economies for sustainable trade. It was created to encourage meaningful discussions amongst policymakers and business executives about the linkages between trade and sustainability.
Second in the series, the STI 2018 evaluates the readiness of 20 Indo-Pacific economies to trade in a manner that provides environmental and social benefits in addition to economic growth.
Overview of the STI 2018 findings
The Sustainable Trade Index 2018 shows that bad policy choices are impeding Asian economies, particularly the richer ones, to participate sustainably in trade. This is a worrying trend that requires policy attention.
- As trade tensions are rising and protectionist forces are on the march, trade sustainability - and more particularly, the equitable distribution of trade benefits - have become essential considerations.
- The achievement of balanced economic, environmental and social outcomes through trade encourages global engagement and builds stronger economies.
- The lack of achievement, therefore, can hobble economic growth, heighten social tensions and strain international relations.
- On the positive side, some middle-income economies (in per capita terms) such as Sri Lanka, China and Vietnam have leapfrogged the richer ones on trade sustainability, and they are turning this into a competitive advantage.
Access the Hinrich Foundation Sustainable Trade Index 2018 resources:
- Sustainable Trade Index 2018 report
(available in EN, ZH and VN) - Infographics
- Data workbooks
- Press release
- Fact sheet
- 20 country reports
![]()
![]()
The Sustainable Trade Index 2018 dataset and country-specific reports
The detailed results for the 20 economies reviewed in the STI are presented in an excel format. Results can be compared across economies, indicators and years.
The STI 2018 also includes an in-depth breakdown of a country's performance on the 2018 Index.
| 1st | Hong Kong | 11th | India | ||||
| 2nd | S.Korea | 12th | Malaysia | ||||
| 3rd | Singapore | 13th | Thailand | ||||
| 4th | Japan | 14th | Indonesia | ||||
| 5th | USA | 15th | Brunei | ||||
| 6th | Taiwan | 16th | Pakistan | ||||
| 7th | Sri Lanka | 17th | Bangladesh | ||||
| 8th | China | 18th | Laos | ||||
| 9th | Vietnam | 19th | Cambodia | ||||
| 10th | Philippines | 20th | Myanmar |
It is now abundantly clear that countries that fall short on trade sustainability face competitiveness, social and environmental issues. APAC economies are encouraged to use the index to benchmark their performance and view positive examples of trade policy.
***
The Sustainable Trade Index is currently in its fifth edition. You may access the other editions below:
© The Hinrich Foundation. See our website Terms and conditions for our copyright and reprint policy. All statements of fact and the views, conclusions and recommendations expressed in this publication are the sole responsibility of the author(s).
Highlight of related news
Vietnam Moves Up on the Sustainable Trade Index

Dezan Shira & Associates featured the Hinrich Foundation Sustainable Trade Index 2018 in its Vietnam Briefing report.
PH among ‘top performers’ in Asia on sustainable trade

Philippines shows major improvement, becomes ‘most educated population’ among all low income countries on the 2018 Hinrich Foundation Sustainable Trade Index.
Hong Kong takes top spot in 2018 Sustainable Trade Index

Feature on Hong Kong’s first place ranking and other key findings from the Hinrich Foundation Sustainable Trade Index 2018.
Asian trade bucks the protectionist trend – but struggles with sustainability

Coverage of key themes and top results from the Hinrich Foundation Sustainable Trade Index 2018.
Asia has “broadly regressed” on trade sustainability
The 2018 Hinrich Foundation Sustainable Trade Index is highlighted in article about trade sustainability in Asian economies.
Past events