How to use it
Red Ink: Estimating Chinese Industrial Policy Spending in Comparative Perspective
Published 06 December 2022
The Center for Strategic and International Studies analyzed Chinese industrial policy spending in a paper published earlier this year. The report compared China’s industrial policy spending with that of other key economies. Here's how to use the CSIS report.
Here’s how to use Red Ink: Estimating Chinese Industrial Policy Spending in Comparative Perspective.
Why the report matters
2022 may mark a new era for industrial policy in the United States with legislation like the CHIPS Act and the Inflation Reduction Act aimed at increasing US domestic manufacturing. This trend is inspired by the industrial policies China has pursued to build manufacturing capacity and locally-based supply chains. As the US takes these cues, it is more important than ever to assess critically the success and failure of such policies in China and other economies.
This report provides readers with a meaningful analysis of what constitutes industrial policy, produces a high-quality estimate of China’s industrial policy spending, and puts such spending into context by measuring it against “seven comparison economies”: Japan, South Korea, Brazil, France, Germany, and the United States.
The report provides policymakers the ability to make data-driven decisions and highlights the need for transparency and better tools for calculating the value of industrial policies.
What’s in the report
The report contains six chapters that
- Estimate industrial policy spending in China and in seven comparison economies and explain the methodology used.
- Examine the historical evolution of industrial policy in each of the seven comparison economies and industrial policy tools used.
- Analyze China’s aluminum, semiconductor, and electric vehicle sectors to demonstrate the impact of industrial policy in China, filling gaps in data gathered under the report’s methodology.
- The report’s findings, and the need for greater transparency from governments about industrial policy spending.
How to find the insights
This report contains key insights on China’s industrial policy spending, in isolation and in the context of the seven comparison economies.
Resetting the Debate on Industrial Policy Spending | Overcoming the Data Gap | China as the Big Spender | China’s New Path | Filling the Data Gaps with Sectoral Studies | Making the Numbers Matter
Resetting the Debate on Industrial Policy Spending
- Advanced economies typically employ explicit industrial policy tools and are more transparent than economies with less state capacity rely more on implicit mechanisms. (p. 6, Table 1.1)
- This report acknowledges that there is no consensus on what constitutes industrial policy. It defines industrial policy as any state intervention that reallocates resources to support firms or sectors to achieve policy objectives. (p. 7)
Overcoming the Data Gap: Estimating China’s Industrial Policy Instruments
- Estimating the size of China’s industrial policies is difficult because of scarcity of data and the complexity of China’s economy. (p. 9)
- By this report’s best estimates, China’s industrial policy spending is enormous, estimated cumulatively at RMB 1.71 trillion in 2019, and shows no signs of declining over time. (pp. 9-10)
- China uses diverse instruments; direct subsidies (RMB 437 billion in 2019) to firms and below-market credit to state-owned enterprises (SOEs) (0.5 percentage points below what private firms pay) are the most significant tools. (pp. 10-12, 29, Figures 2.2-2.3, 3.3) (p. 13-14, Figure 2.4) (p. 16)
- Most subsidies are directed at spending for capital goods, materials, and technology hardware; the biggest beneficiaries are firms in software, technology hardware, automobiles, transportation, and semiconductors. (p. 13)
- “Other tax incentives” for 2019 were estimated at RMB 410 billion for listed SOEs and private firms. (p. 13)
- China’s state investment funds, or government guidance funds (GGFs), provided a subsidy of RMB 70 billion to Chinese firms in 2018. (p. 17-18, Figure 2.6)
- Localities can offer land-use rights at below-market prices, estimated as a subsidy equal to RMB 206 billion, or 0.21 percent of GDP in 2019. (p. 18)
- SOEs are not expected to pay bills on time, implying a zero-interest loan from private firms to SOEs, estimated at RMB 38 billion, or 0.04 percent of GDP in 2019. (p. 19)
- The implicit subsidy value of debt-for-equity swaps to reduce corporate leverage was estimated at RMB 4.5 billion in 2019. (p. 19)
China as the Big Spender: Comparative Estimates of State Support
- China is an outlier in spending on industrial policyand its spending is important given its role as the world’s second largest economy by share of global GDP, and as the largest in terms of manufacturing goods exports. (p. 22-23, Figure 3.1) (p. 30-31, Figures 3.4-3.6)
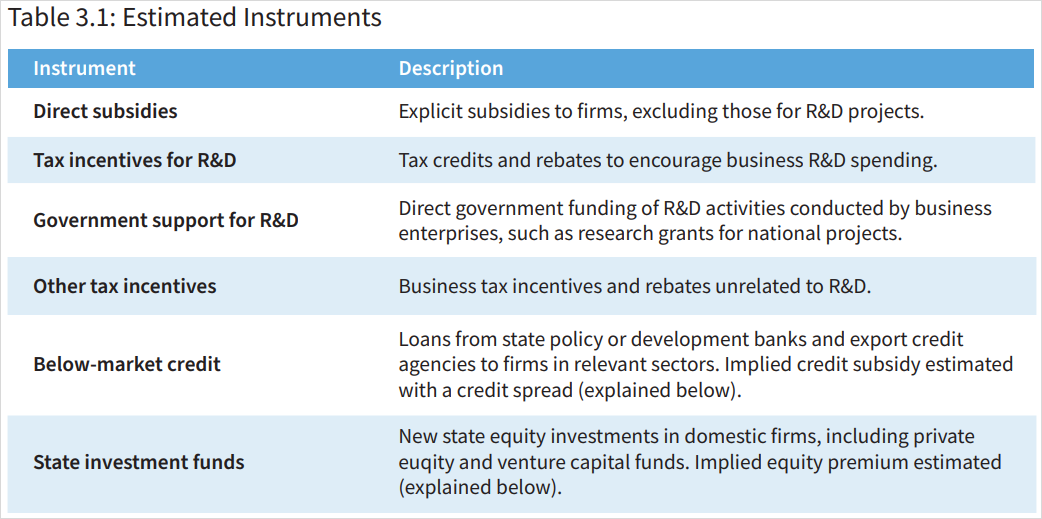
- Six policy instruments are measurable across the seven comparison economies: direct subsidies to firms, R&D and other tax incentives, government-financed business R&D, below-market credit to SOEs, and state investment funds. (p. 24, Table 3.1)
- “R&D first” economies - France, South Korea, Taiwan, and the United States - use tax incentives and government support. (p. 31-32, Figure 3.7)
- “Big investor” economies - China, South Korea, and Taiwan – rely on state investment funds. (p. 31-32, Figure 3.7)
- “Policy bankers” economies are Brazil, Germany, and Japan. (p. 31-32, Figure 3.7)
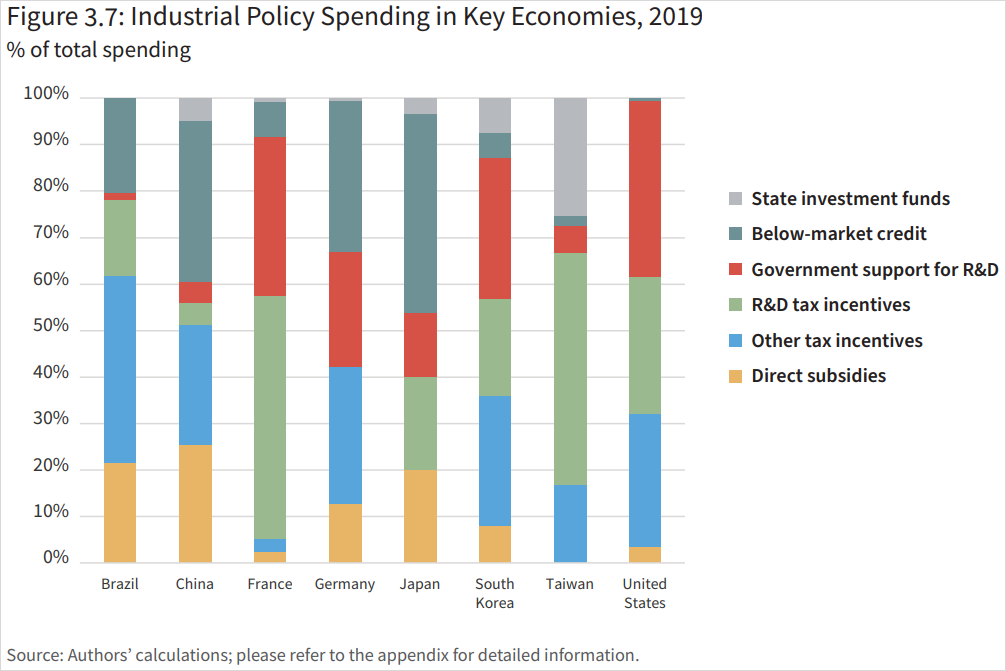
- China spends more on direct subsidies than other economies, and provides disproportionate support through credit given its state-owned banking sector. (p. 31)
China’s New Path: Comparative Evolutions of Industrial Policies
- In the seven comparison economies, vertical industrial policies (including import substitution and a strong directive role for the state) were most pronounced before the 1980s, while a market-led approach was pursued in the 1980s and 1990s. From the 2000s, industrial policies have focused on state support for innovation, R&D, and SMEs. (pp. 35-36, Table 4.1)
- Vertical industrial policies fell out of favor due to expense, distortionary effects, and perception as an obstacle to innovation. WTO rules allowed countries to retaliate against key industrial policy tools like export subsidies. (p. 35)
- China’s rise using industrial policies, geopolitical tensions, supply chain concerns, climate change have led governments to reconsider state-led interventions. (p. 36)
China
- China’s approach to industrial policy differs from other regional economic powerhouses – Hong Kong, Singapore, South Korea, Taiwan, and Japan – its government has a high degree of control over the entire economy; was relatively open to and reliant on foreign investment; has a larger domestic market than any of its peers for at least a decade; uses unique industrial policy instruments, like government guidance funds. (p. 37)
- After ebbing in favor of economic liberalization in the 1990s and 2000s, China’s industrial policy reemerged after 2006 to focus on high-tech companies and innovation. (p. 38)
- Beijing seeks high-income status without further expanding the service sector’s share of the economy. (p. 38)
- In the early 2000s, state support through informal or in-kind transfers was more important; now, formal fiscal measures and government spending has grown. (p. 39)
- China is pursuing vertical industrial policies at the frontier of innovation while still a middle-income country, unlike other East Asian economies. (p. 40)
Japan
- From 1945 to 1960, Japan had direct government control of foreign exchange allocations, regulated market prices, and promotion of the coal and steel industry. (p. 40)
- From 1973 to 1990s – its government became more supportive of free trade and shifted to corrective policies providing guidance and support to key sectors. (p. 40)
- After 1991 – government focus shifted to structural reform of the economy, with a focus on horizontal R&D. (p. 40)
South Korea
- From the 1960s, South Korea pursued a policy of export-led industrialization and policy support for strategic sectors. (p. 41)
- The 1980s and into the 1990s saw liberalization to rebalance the economy and join multilateral organizations like the WTO and OECD. (p. 41)
- From the early 2000s, the government began supporting emerging companies in the ICT sector. (p. 41-42).
- The government’s latest policies focus on digital trade and decarbonization. (p. 42)
Taiwan
- Since the 1970s, Taiwan’s government has supported private industries through its National Development Fund, R&D support, and industrial clustering, with particular success in semiconductors. (p. 42)
- State spending has lessened in favor of policy guidance and coordination. (p. 42)
- Since 2016, Taiwan has promoted core strategic industries – digital technologies, cybersecurity, biotech and medical technologies, national defense, green and renewable energy, and strategic stockpile industries – with special funding initiatives. (p. 43)
France
- France has a long history of state intervention in the economy, including nationalization of industries and banks, production of five-year plans, R&D funding. (p. 44)
- French government is a shareholder in 83 large and many small companies. (p. 44)
- After privatizations and market liberalization in the 1980s and 1990s, since 2005 France relaunched industrial policy, with a focus on high-tech sectors, promoting industrial competitiveness and the energy transition by providing R&D and other funding. (p. 44)
Germany
- Germany has long been wary of direct economic intervention. Industrial policy has focused on horizontal measures, research, export orientation, and the “social market economy”. (p. 44)
- Germany’s basic industrial policy principles accept that structural change is required for a dynamic economy and the government should promote change with a good business environment. (p. 45)
- Germany has used development banks to support SMEs, export finance, international development, and funding for policy priorities like the energy transition; in the 1980s and 1990s, incentives, credit support, and subsidies to integrate East German industries into the economy. (p. 45)
United States
- The US does not overtly embrace industrial policy, but a “hidden” developmental state exists in the defense sector and in state-support for technologies, R&D, and early-stage commercialization in the civilian sector. (p. 46)
- The Cold War period was characterized by national security and space programs. In the 1970s to 1980s concerns over competition from Japan spurred funding to help firms survive from research to commercialization of technologies. (p. 46)
- The 2000s saw support for energy innovations to combat climate change, while the 2010s focused on spurring advanced manufacturing with less public spending. (p. 46)
- Since 2020 the US appears to be initiating a new period of intervention in response to the Covid pandemic and competition from China. (p. 47)
Brazil
- Until the 1980s, Brazil pursued a state-led industrialization strategy that was derailed by the Latin American debt crisis of the 1980s. In the 1990s, Brazil pursued trade liberalization, market deregulation, and SOE privatization. (p. 47)
- In the early 2000s, industrial policy returned to focus on incentives for strategic sectors, coordination of state and private resources, and attempts to weaken the exchange rate while protecting domestic markets. (p. 47)
- Brazil has struggled with an unfavorable exchange rate spurred in part by the commodity price boom, which boosted Brazil’s agricultural and natural resources exports, but weakened the export competitiveness of Brazil’s manufactured goods. (p. 48)
How to apply the insights
- By comparing the historical use of industrial policies in the seven comparison economies, the report makes clear that China is also an outlier in its spending trajectory.
- Most comparison economies shifted away from industrial policies as they approached the “innovation frontier”. As China approaches a similar point in its industrial development, it is spending more.
- It is important that policymakers take note of this approach, though it may lead to the adoption of more policies directed at countering competition from China, and more trade distortions.
Filling the Data Gaps with Sectoral Studies
- To improve accuracy in estimating China’s industrial policy spending, it helps to examine key sectors representing inputs (aluminum), intermediate goods (semiconductors), and final goods (electric vehicles) with significant support. (p. 49)
Aluminum
- By 2016, China accounted for over 50 percent of global aluminum production, having added more production capacity between 2011 and 2016 than the rest of the world combined in the previous 25 years. (p. 50)
- Governments provided US$70 billion to aluminum companies between 2013 and 2017, with 85 percent going to 5 Chinese companies. The largest support came from the state-owned financial sector, including US$56 billion in below-market credit (p. 51)
- Incomplete VAT rebates and export taxes accounted for a de facto tax incentive of 15 percent for unrefined Chinese aluminum products between 2013 and 2017. Chinese aluminum refiners also benefitted from large domestic supply of cheap unrefined aluminum due to Chinese export barriers. (p. 51)
Semiconductors
- Semiconductor manufacturing is both capital and R&D intensive, with capital expenditures accounting from 30 to 40 percent of annual revenues. (p. 51)
- The level of support provided to Chinese firms is far larger than any other country provides. (pp. 52-54, Figures 5.2 and 5.3)
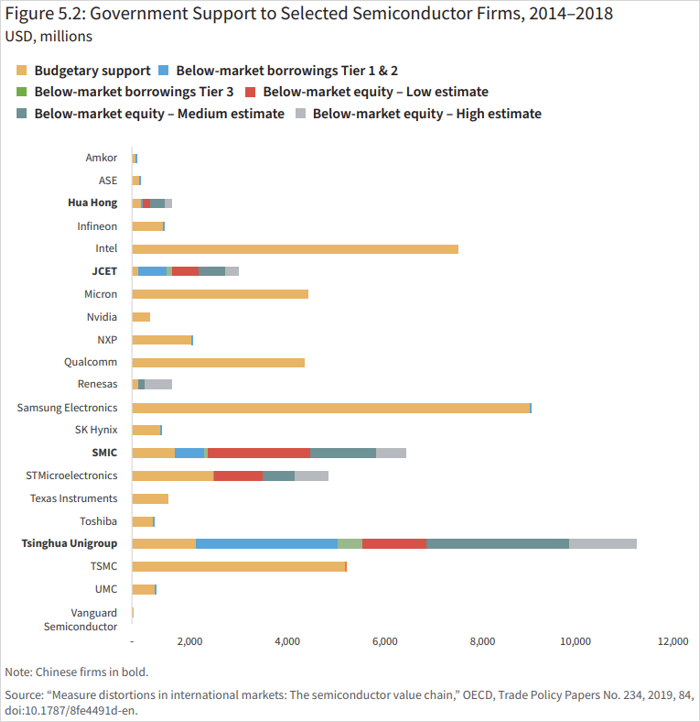
- 86 percent of all below-market equity support identified in the study went to Chinese firms, reflecting the growth of GGFs since 2014. (p. 52)
Electric Vehicles (EVs)
- China’s approach to EV industrial development policies are explicitly linked to a strategy of industrial expansion and technological leapfrogging. (p. 55)
- EV manufacturers receive consumer subsidies, R&D tax credits, and local government support including tax and land incentives. (p. 55)
- Public procurement for EVs in China is estimated to total more than RMB 100 billion between 2019 and 2021. (pp. 55-56)
Making the Numbers Matter
- Governments and institutions should broaden the scope of tools they use to calculate the value of industrial policy beyond what is currently included in relevant WTO agreements. (p. 61)
- Requiring governments consistently to provide comprehensive and detailed information about how they support their firms and industries is important. (p. 61)
- Covered support should include subsidies, government expenditures by type, government procurement, government funding for business R&D, local government support, support from development or policy banks and state investment funds, and tax benefits. (p. 62)
Conclusion
This CSIS report raises important questions but provides few answers. The authors demonstrate the outsized and extraordinary nature of Chinese industrial policy spending, alone and in comparison with other economies. What does this mean for the global economy? What should other economies do about it? These are questions for the international community to answer.
What is very clear is the need for policymakers to consider these questions and decide how to proceed with their own efforts to gather information and enhance transparency in order to understand the scope of support provided and how to adopt similar funding or to respond to economies that may want to pursue a path similar to China’s.
***
Complementary reports and analysis
Hinrich Foundation
- CHIPS Act: “Winning the 21st century” or wasteful industrial policy?
- CHIPS as usual: A defense of US industrial policy
- Subsidies and market access: Towards an inventory of corporate subsidies by China, the EU, and the US
- Industrial subsidies and the pressing need for action
- US and EU look for a deal on subsidies while eyeing China
- Is the pandemic bringing back industrial policy?
External Resources
- Industrial Policy and International Competition – World Economic Forum
This paper outlines the state of play and issues of concern in the areas of subsidies, state ownership, and the use of trade remedies; and emphasizes the need for intergovernmental discussions to update existing rules and improve transparency. - Could Venture Capital Be the New Frontier in Great-Power Competition? – Foreign Policy
The article explains the role of America’s private capital markets in advancing U.S. strategic interests. - EU Warns US of Potential Retaliation in Green Subsidies Dispute – Bloomberg
The European Union called on the US to amend certain tax benefits contained in recently-enacted green legislation given what it called their discriminatory nature, and warned of potential retaliation. - Oh, what a lovely subsidy war – Financial Times
EU producers want to be eligible for subsidies, but the US is unlikely to include them.
© The Hinrich Foundation. See our website Terms and conditions for our copyright and reprint policy. All statements of fact and the views, conclusions and recommendations expressed in this publication are the sole responsibility of the author(s).