How to use it
Asian Economic Integration Report 2023: Trade, Investment, and Climate Change in Asia and the Pacific
Published 28 March 2023
2022 marked an eventful year in global trade and investment. As pandemic pressures eased the world over, new inflation-related constraints were introduced, and climate goals took center stage in shaping trade flows. The Asian Development Bank’s annual Asian Economic Integration Report provides a summary of how these various pressures and crises are impacting economies of the Asia-Pacific.
Here’s how to use the report entitled Asian Economic Integration Report 2023: Trade, Investment, and Climate Change in Asia and the Pacific.
Why is the 2023 Report important?
The Asian Economic Integration Report 2023: Trade, Investment, and Climate Change in Asia and the Pacific (AEI Report 2023) provides policymakers, lawmakers, and anyone interested in Asia’s economic landscape a comprehensive but high-level resource for grasping the state of play in the economies of Asia and the Pacific. It includes up-to-date economic analysis and trends, as well as a summary of many cooperative initiatives and regional trade agreements, all in comparison with global trends and developments in other regions. This year’s edition importantly addresses the relationship between trade, investment, carbon emissions, and pollution, the position of Asia at the nexus of these factors, and the latest tools and attempts to counter climate change while balancing economic interests.
Chapter 1: Regional Cooperation for Transformative Economic Recovery
- Multiple challenges, including growth slowdowns in the US, the EU, and China have weighed down growth for developing Asia to 4.2% in 2022 and 4.6% in 2023. (p. 1)
- Cross-border economic activity in 2022 is uneven:
- goods and services trade is strong but losing momentum (pp. 1-3, Figures 1.1 and 1.3);
- FDI is holding up but showing signs of apprehension, while net portfolio investments have dropped in 2022 (pp. 3-4, Figures 1.4 and 1.6);
- Overall, remittances remain buoyant, and tourism is recovering in key economies but the picture is mixed across Asia. (pp. 5-6, Figures 1.8-9).

- Through 2020, Asian regional integration remained stable. (pp. 6-7, Figures 1.10-11)
- Asia had 50% of global emissions in 2019, hosts more carbon-intensive industries than any other region, and in 2018, carbon-intensive exports accounted for 62% of total exports. Regional cooperation and domestic tools will be critical to address emissions as well as mitigate supply chain disruptions. (pp. 7-11, Figure 1.12, Box 1.1)
- Trade digitalization is important to economic growth, and agreements liberalizing digital trade can unleash digitalization for tourism and other parts of the economy. (pp. 11-13, Table 1.1)
Chapter 2: Trade and Global Value Chains
- Asia’s goods and services trade volumes recovered in 2021 driven primarily by the PRC, with goods strongly higher than 2019 levels, and services trade not yet returning to pre-pandemic levels; the PRC’s Covid lockdowns in early 2022 drove trade volumes down again in the first half of the year. (pp. 18-20, Figures 2.1-2, Box 2.1)
- In 2021, Asia’s trade with outside regions grew even slightly faster than trade within Asia and participation in global and regional value chains increased; Asia’s intraregional trade is lower than the EU but higher than North America, with the PRC holding the largest trading share of trade in the region. Intraregional trade shares were greatest in the Pacific and Oceania subregions. (pp. 21, 24, 25-30, Figures 2.7-16)
- The impact of the war in Ukraine has played out in energy and food prices. Since the second half of 2021, the growth of food exports and imports has declined, while trade in energy commodities has grown; food prices have returned to January 2022 levels (as of November 2022) while energy prices have remained higher. (pp. 30-33, Figures 2.17-18)
- Singapore, Thailand, the Marshall Islands, and Korea are energy importers most vulnerable to volatile energy prices; Kiribati, Tajikistan, Timor-Leste, and the Marshall Islands are the most food import-dependent economies; currency depreciations were highest in Sri Lanka and Laos. (pp. 34-37, Figures 2.20-22)
- Prohibiting export restrictions, enhancing trade facilitation and alternative transportation routes, finding solutions to address public stockholding, providing income subsidies, and promoting commodity derivative markets are policies that can help lessen the severity of food and energy crises. Nontariff measures imposed on Asia continue to peak. (pp. 36-38, 46-50, 52, Figures 2.25-28, Box 2.3).
Chapter 3: Cross-Border Investment
- In 2021, global FDI inflows recovered (the US was the top 2021 FDI destination) to pre-pandemic levels reaching a new peak in Asia of US$ 633 billion, though expectations for 2022 inflows are more modest given geopolitical and pandemic headwinds. (pp. 57-59, Figure 3.1, Table 3.1)
- Global greenfield FDI and M&A deals recovered in 2021; in Asia, investment grew only modestly in 2021 and slowed in 2022, buoyed by M&A transactions; manufacturing and tertiary sectors accounted for over 90% of Asia’s total FDI. (pp. 59-62, Figures 3.2-5)
- Global outward FDI recovered to 2017 levels in 2021, with the US by far the largest source; Asian outward investment recovered in 2021 but declined in 1H 2022 save for M&A deals. (pp. 67-68, Figures 3.10-11, Table 3.4)
- Domestic investment laws are important for attracting and directing foreign investment, particularly tax incentives; corporate income tax incentives are a significant component and the most common in Asia. (pp. 70-75, Figures 3.12-16, Table 3.5)
- New global agreements on tax rules could offset the advantages of local tax incentives, prompting a rethink of tax incentives globally and across Asia; rethinks are also necessary to consider how to best incentivize investment in green technologies; regulatory incentives should be carefully calibrated to enhance FDI in sectors like telecommunications. (pp. 77-83)
Chapter 4: Financial Cooperation
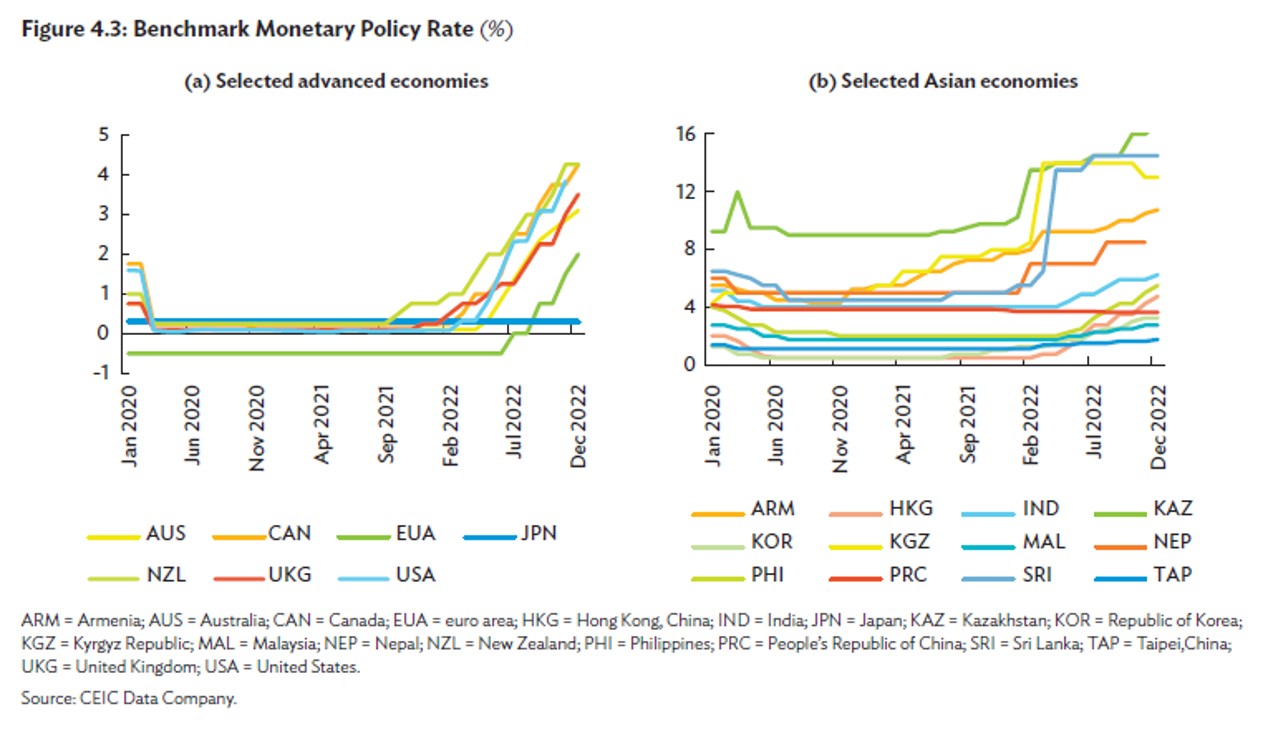
- Inflation is weighing on economic recoveries, driving central banks to tighten monetary policy, and leading to greater divergence between US and Asian interest rates, increasing default risks in Asian economies. (pp. 89-92, Figures 4.1-8)
- Growing economic uncertainty poses the possibility of capital outflows, though actual outflows are relatively light; capital markets are volatile, prompting asset price corrections across Asia. (pp. 93-97, Figures 4.9-18)
- Rising global interest rates, weakened domestic currencies, and high incurrence of both public and corporate debt over the course of the pandemic could combine to create debt servicing risks and consequent financial stability risks. (pp. 97-99, Figures 4.19-21)
- Asia invested more outside of the region in 2021 but also became more integrated as intraregional portfolio equity and debt shares increased in 2021. (pp. 101-104, Figures 4.24-28)
- The US dollar remains the dominant currency for Asian international investment, with 44% of Asia’s international asset holdings denominated in the dollar, while most external liabilities are denominated in domestic currencies; USD is still the preferred currency for trade invoicing. (pp. 103-108, Figures 4.29-30, 4.33-34)
Chapter 5: Movement of People
- Although the Covid pandemic significantly disrupted international migration, by December 2022, 73.7% of airports and 60% of land and water borders were fully operational, with most mobility restrictions rolled back over 2022. (pp. 111-12, Figure 5.1)
- 1 in 3 global migrants comes from Asia; the top destinations for migrants outside of Asia are North America, the Middle East, and Europe. Outbound migration from Asia continued through the pandemic and rebounded strongly in 2022, facilitating remittances to migrant-sending economies. (pp. 112-14, Tables 5.1-2, Figures 5.2-3)
- The Russian invasion of Ukraine affected labor dynamics, causing Central Asian migrants to leave Russia and Russian workers to migrate to Central Asian economies. (p. 114)
- Host economies are demanding more highly skilled workers to complement strategic economic focii toward technology, automation, and other high-value industries. (pp. 114-17, Figures 5.4-5)
- Global remittance inflows rebounded in 2021 by 9.9% after a pandemic-related contraction of 1.5% in 2020 and are expected to grow 4.7% in 2022 to a record high of US$340.7 billion in Asia. In Asia, they are second in importance to FDI inflows and the largest share of external finance in Latin America and Africa. (pp. 121-23, Figures 5.7-8, Table 5.4)
- Global tourist arrivals and tourism receipts rebounded strongly in 2022, but at best to only half of 2019 levels; tourism sector recovery in Asia is lagging other regions due to highly restrictive Covid travel policies and requirements. In Asia, tourism is estimated to contribute US$2.7 trillion in 2022 (pp. 132-41, Figures 5.11-16 and 5.18-19)
- Tourism can recover sustainably in Asia by expanding markets beyond traditional sources, the greatest challenges to reaching 2019 levels are the economic environment, high transport costs, and ongoing travel restrictions. (pp. 139-46, Figures 5.18-19)
Chapter 6: Updates on Subregional Cooperation Initiatives
- Most subregional initiatives show that intra-subregional integration is increasing in Asia, esp. in infrastructure integration and technology and digital connectivity. Subregional groupings have incorporated climate change into their plans; ADB is addressing climate change in the Pacific, where island nations are particularly vulnerable. (pp.157, 186-88, Figures 6.1-2)
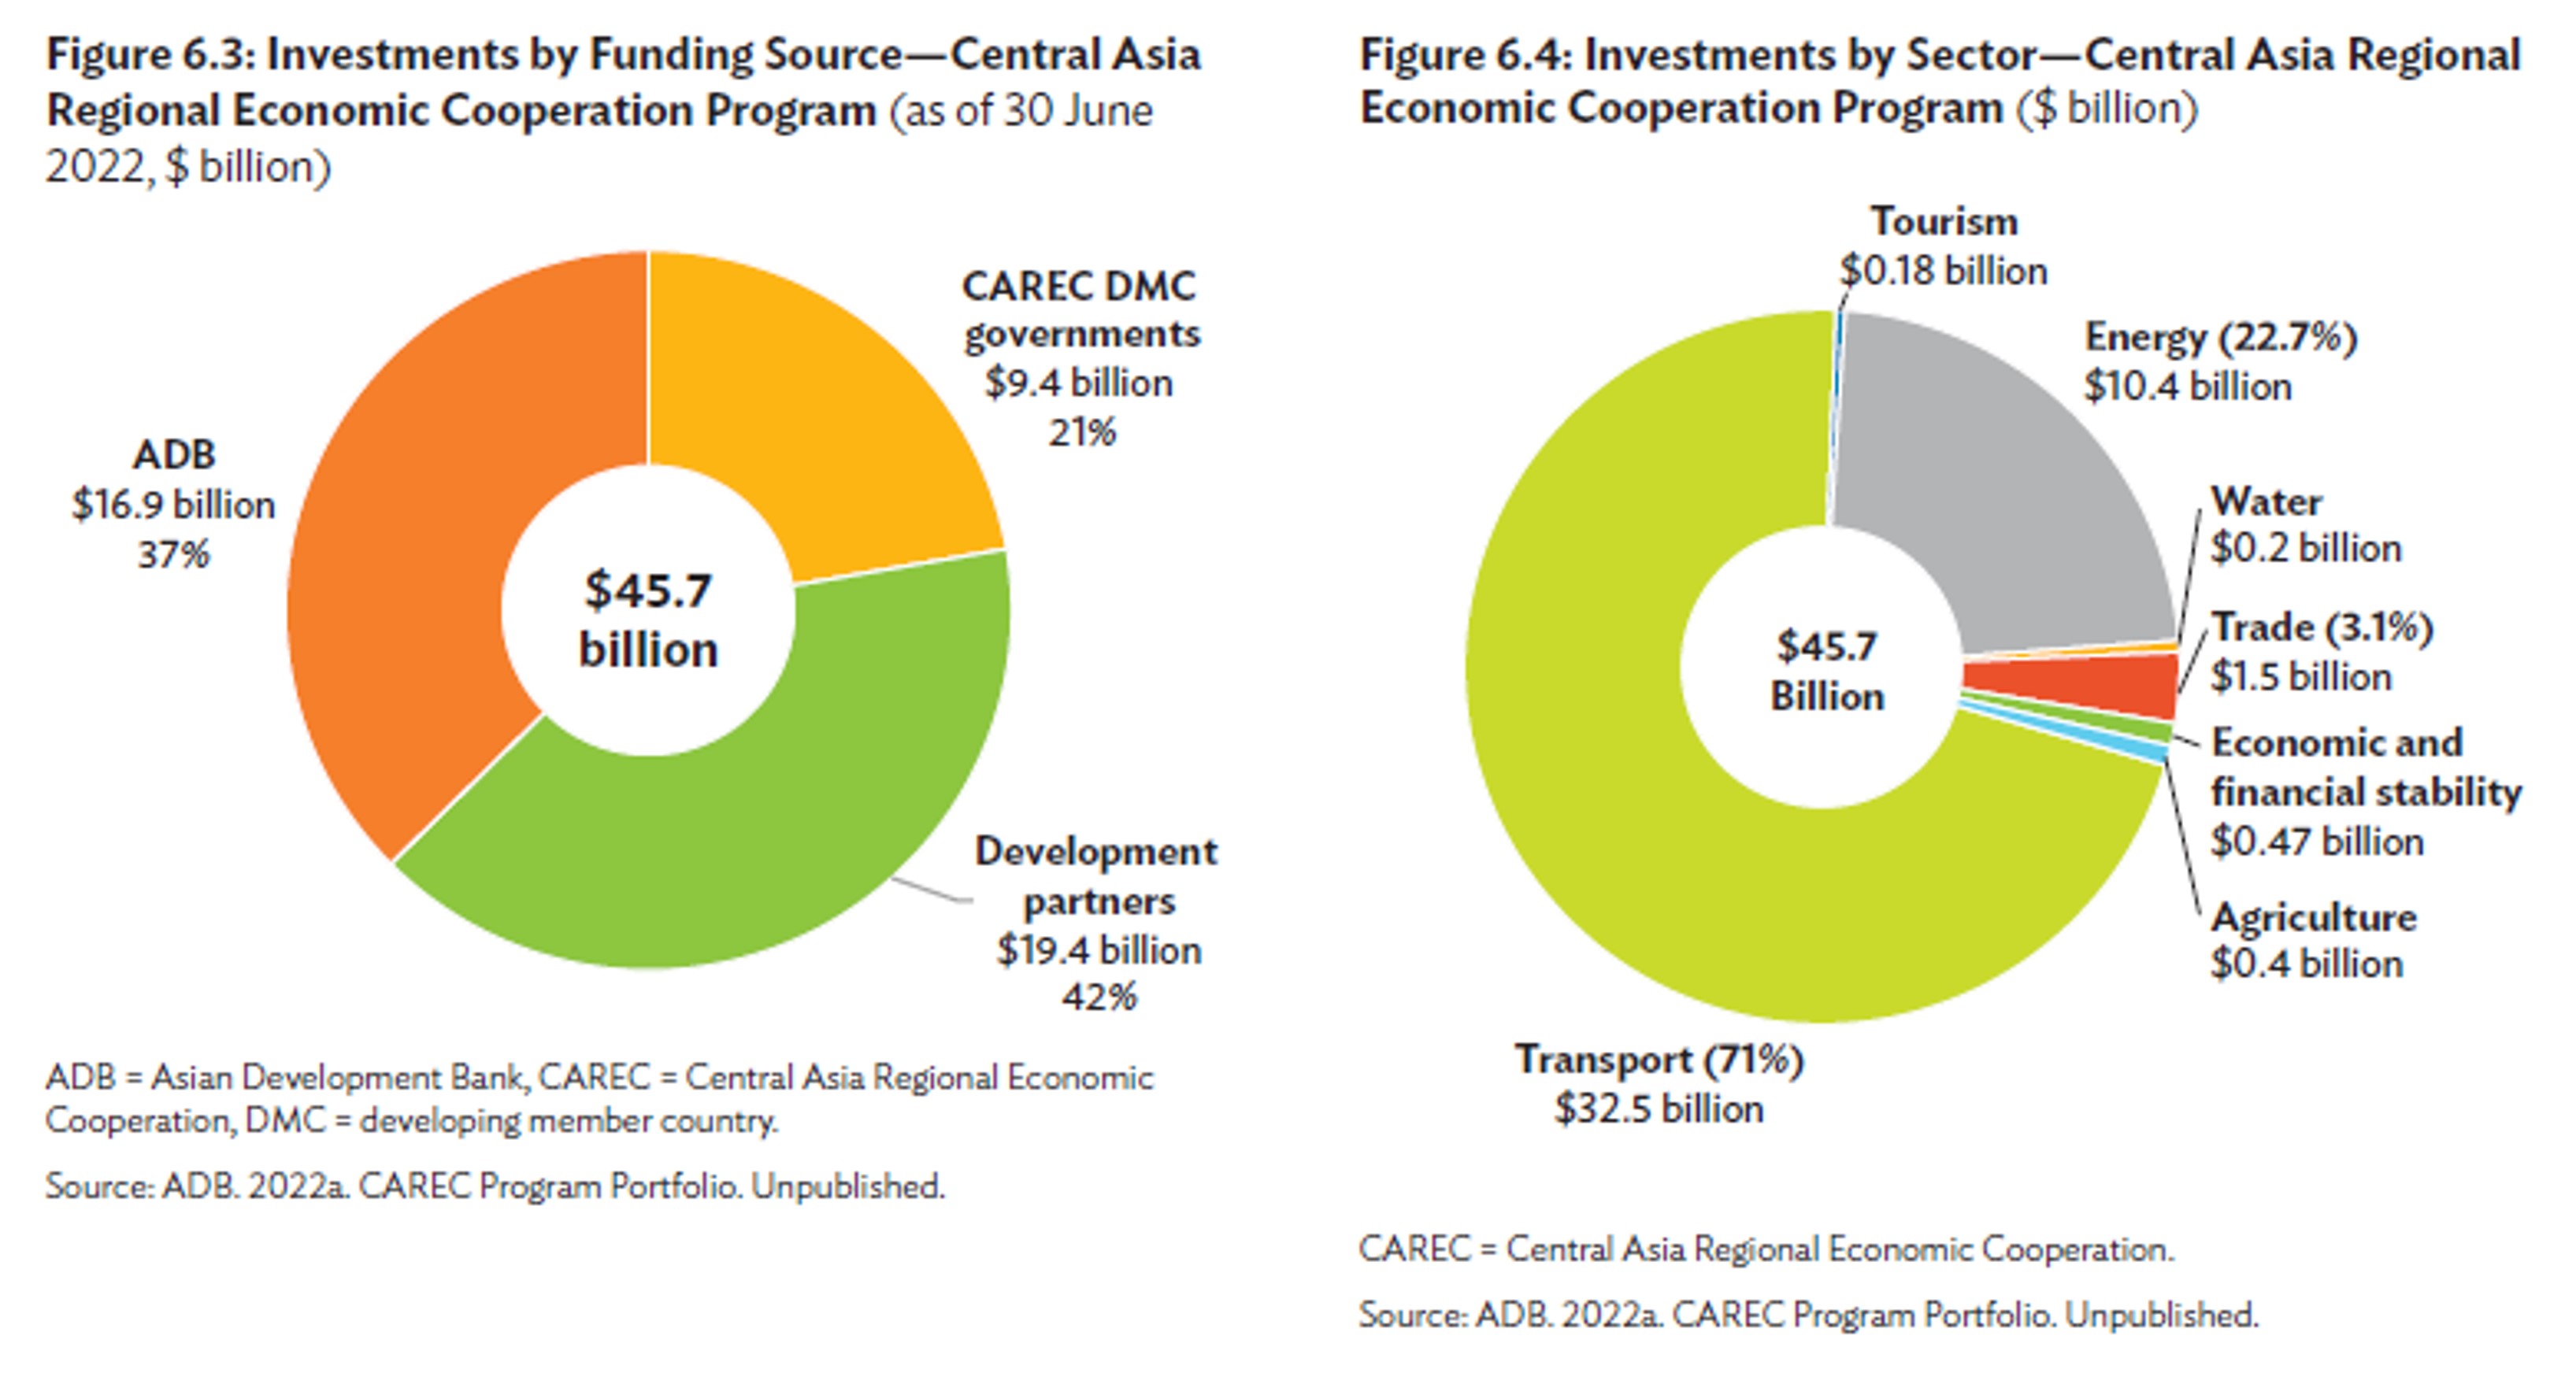
- The Central Asia Regional Economic Cooperation Program (CAREC), a partnership of 11 countries of Central Asia plus China, Mongolia, and Pakistan, in 2022 reached US$45.7 billion in regional investment projects, primarily in transportation. (pp. 158-64, Figures 6.3-4)
- The Greater Mekong Subregion Program (GMS), encompassing Cambodia, China, Laos, Myanmar, Thailand, and Vietnam, aims to enhance community, connectivity, and competitiveness for the region and has increased connectivity by adding thousands of kilometers of railway lines and electricity transmission lines, among other projects. (pp. 165-69)
- The Brunei-Indonesia-Philippines East ASEAN Growth Area (BIMP-EAGA) and the Indonesia-Malaysia-Thailand Growth Triangle (IMT-GT) are two initiatives to spur development in remote and less-developed parts of the countries involved; BIMP-EAGA has completed 27 of 88 priority projects. (pp. 169-72)
- The South Asia Subregional Economic Cooperation (SASEC) is a partnership amongst Bangladesh, Bhutan, India, Maldives, Myanmar, Nepal, and Sri Lanka to improve economic cooperation and address development challenges; by 2022, SASEC had built a portfolio of 77 projects amounting to US$18 billion with the largest share for connectivity infrastructure. (pp. 176-80, Figure 6.5)
- ADB supports the Pacific subregion in building connectivity, subregional trade, and the development of regional public goods; in 2022, ADB approved US$86.4 million in regional investment loans and grants and US$51.6 million in regional technical assistance. (pp. 183-86, Figures 6.6-7)
Chapter 7: Trade, Investment, and Climate Change in Asia and the Pacific
- Asian economies are at the nexus of climate change and global production networks; 40% of natural disasters over the past 20 years have occurred in Asia and the Pacific while the region accounted for 35% of world trade in 2020; Asia is also a large contributor to global carbon emissions. (pp. 193-94, Figure 7.1)
- Asia’s carbon emissions in both production and consumption have nearly tripled since 1995 and Asia is a net exporter of emissions given its role as the world’s manufacturer, while the rest of the world is a net importer of emissions, and their emissions have been stable. Within Asia, East Asia, including China, has the highest emissions in gross imports (pp. 196-200, Figures 7.2-8)
- Production has become cleaner in all regions over the last two decades; the carbon emission intensity of Asia’s exports and imports has decreased, though Asia has a high share of traded products from carbon-intensive industries and the emissions intensity of Asia’s exports is higher than in other regions. (pp. 202-5, Figures 7.11-15)
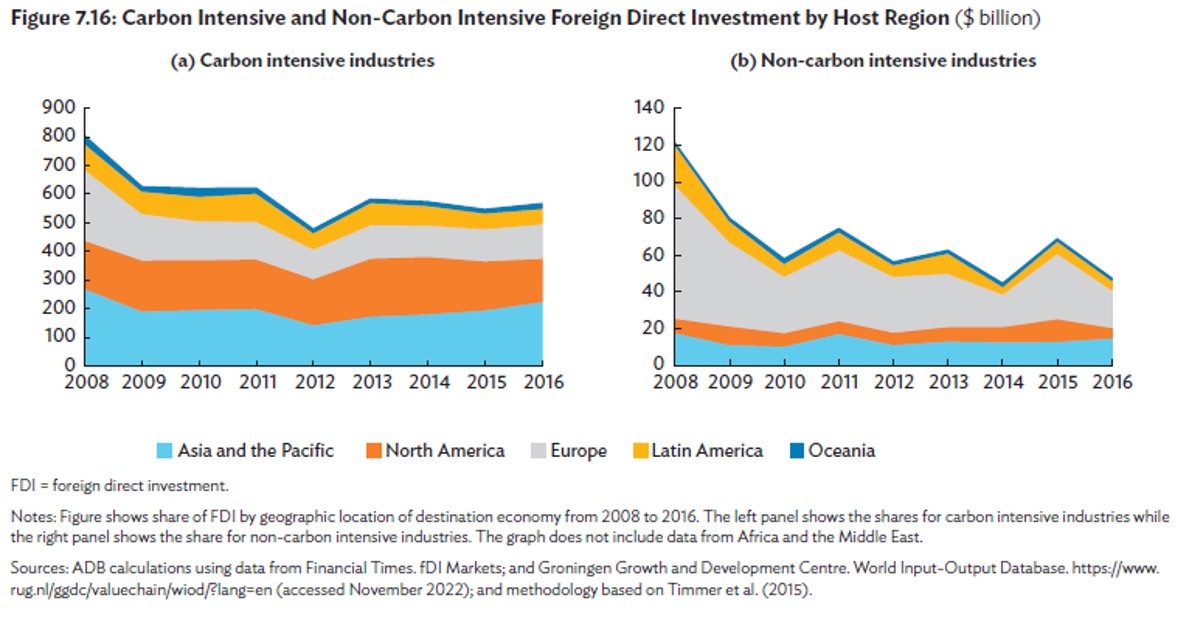
- The nexus between FDI and climate change needs examination; Asia hosts the greatest share of FDI for carbon-intensive industries due to weaker environmental regulations, and FDI to carbon-intensive industries globally has remained stable over the past 15 years; job creation from FDI in Asia is mostly in carbon-intensive industries; FDI in environmental goods and services is growing. (pp. 207-14; Figures 7.16-21)
- Trade in environmental goods and services (EGS) is increasing globally, though, in Asia, trade in environmental services has decreased; more Asian companies are seeking certifications that goods are environmentally friendly; more can be done through trade agreements and reducing trade barriers to promote EGS trade and adoption of carbon taxes. (pp. 216-24, Figures 7.22-28)
- Environmental laws and regulations have been effective in inducing a switch to renewable energy and less-polluting technologies; certification is an important tool but should be adopted with minimal effects on trade and low compliance costs. (pp. 224-28)
- Regional trade agreements and international cooperation can play a greater role in disseminating green technologies through the adoption of interoperable certification systems, mutual recognition agreements for conformity assessments, and climate change mitigation and trade facilitation provisions; much more can be done to address climate change in the context of investment agreements. (pp. 228-234)
- Carbon pricing can help economies reduce emissions cost-effectively; the EU is advancing its Carbon Border Adjustment Mechanism, raising questions about compliance, effectiveness, WTO compatibility, and its impact on exports; an international carbon market may be a more effective approach. (pp. 235-43)
Conclusion
The AEI 2023 Report is an essential annual report providing baseline economic data analyzing trade and investment flows through the economies of Asia and the Pacific. This year’s report especially emphasizes the state of play in Asia and the Pacific with respect to climate change, giving a helpful assessment of what is being done and what more can be done to tackle this existential threat.
Complementary reports and analysis
Hinrich Foundation
- Integration, interoperability and inclusion
- Advancing sustainable development with FDI: Why policy must be reset
- Reviving FDI's transformative power
- To ease ASEAN’s import dependency, strengthen intra-ASEAN trade
External Resources
- Asian Economic Integration Report 2019/2020: Demographic Change, Productivity, and the Role of Technology – Asian Development Bank
This report explores the potential of technology to boost productivity in aging economies. - Asian Economic Integration Report 2021: Making Digital Platforms Work for Asia and the Pacific – Asian Development Bank
This report looks at how regional economies individually or collectively respond to the pandemic by leveraging rapid technological progress and digitalization. - Asian Economic Integration Report 2022: Advancing Digital Services Trade in Asia and the Pacific – Asian Development Bank.
This report explores how Asia and the Pacific can capitalize on growing opportunities in digital services through structural reforms and international cooperation.
© The Hinrich Foundation. See our website Terms and conditions for our copyright and reprint policy. All statements of fact and the views, conclusions and recommendations expressed in this publication are the sole responsibility of the author(s).